How to create multi-channel dashboards with One-Click Report
Create performance dashboards with:
- Multi-channel reporting
- Modifiable templates
- Real-time data
With One-Click Report, you can:
- Use the tool as your primary dashboard to get a clear view of your day-to-day performance across different advertising channels
- Create professional-looking and meaningful reports as a small or medium-sized business without spending huge money on data analysts
- Take advantage of templates to gain insight into what metrics the industry leaders look at and how they organize their reports
- Save yourself hours of data compilation work so that you can make better marketing decisions faster
- Quickly share the data with your team or clients

Everyone needs to track how their marketing efforts work and measure them against their KPIs. You can generate professionally designed reports within Madgicx without having to use other tools and in just one click.
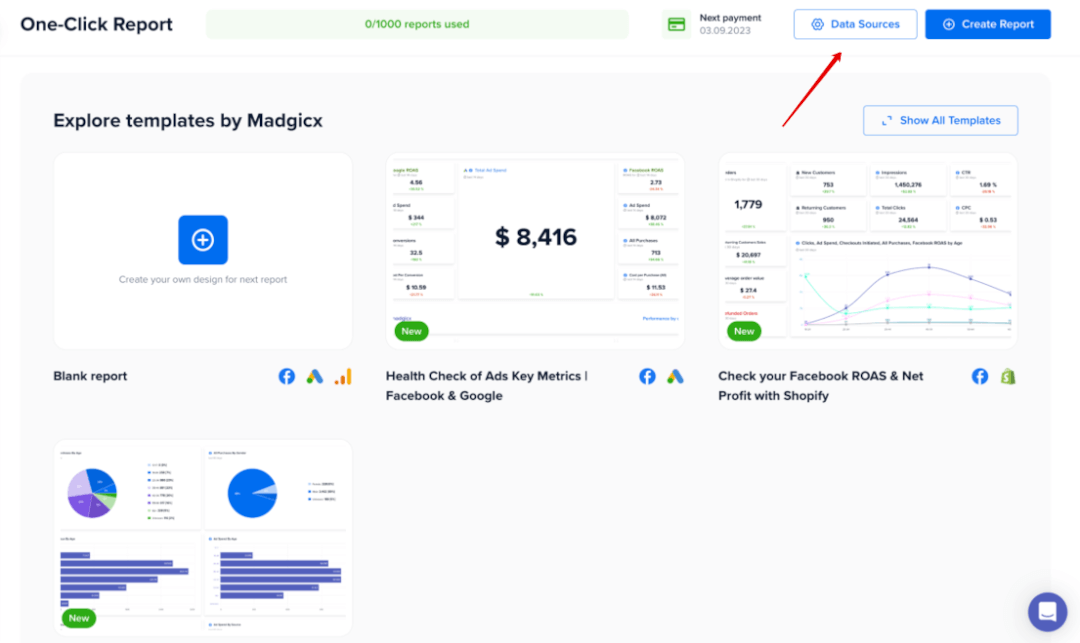
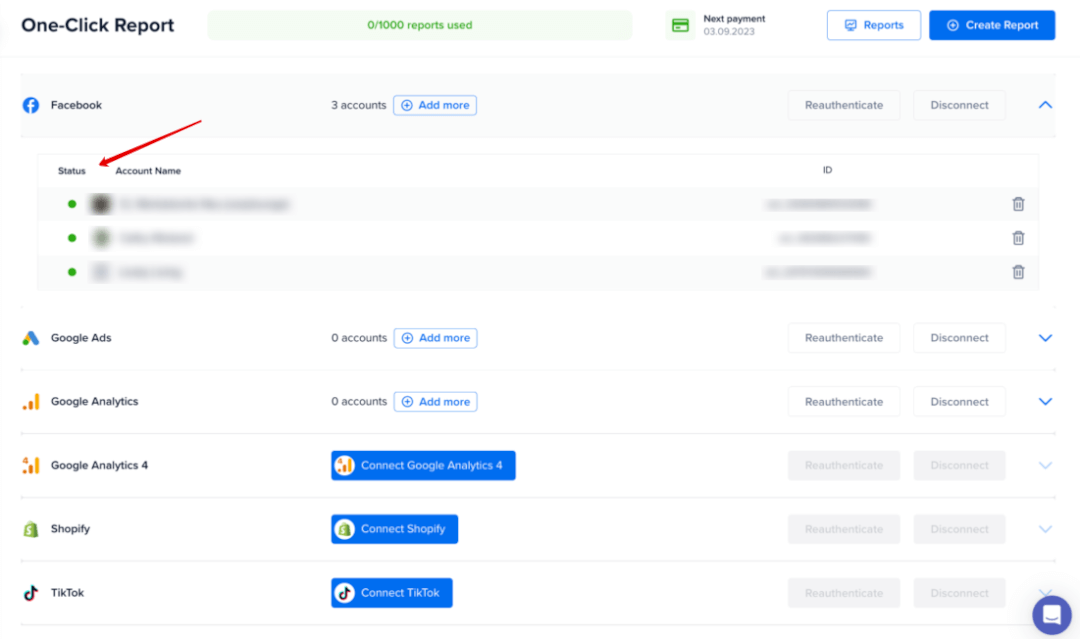
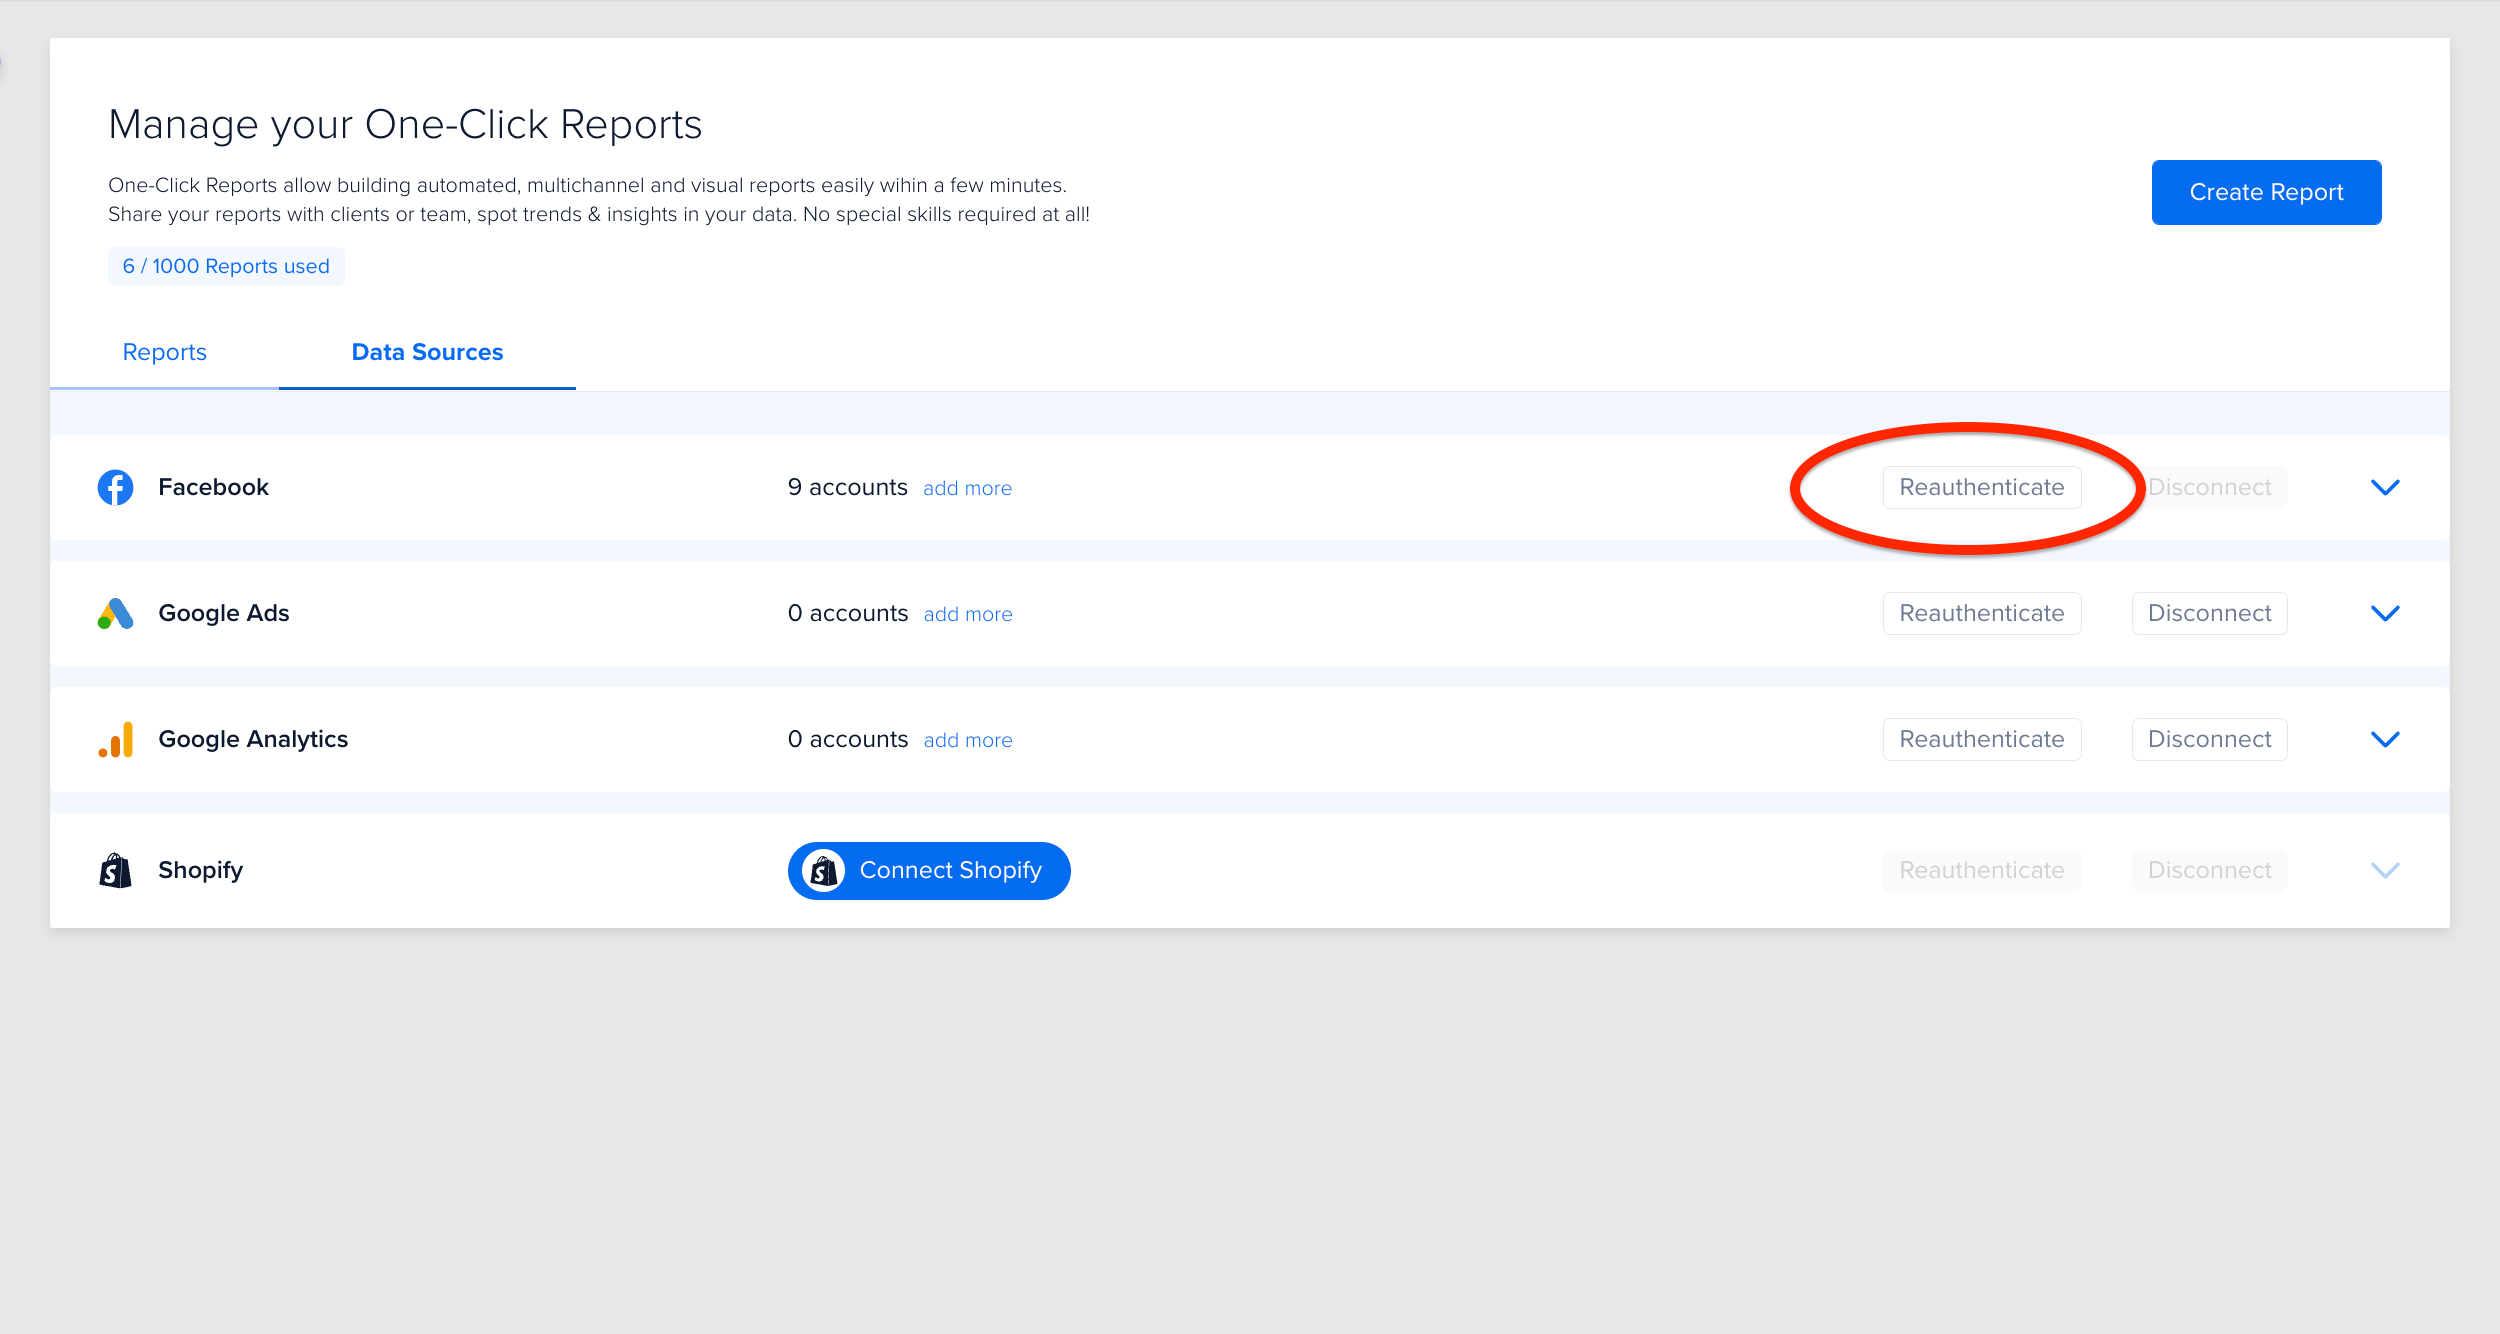
To start creating reports, you first need to connect your accounts (data sources). You can connect as many accounts as you like across all channels: Meta, Google Ads, TikTok, GA4, and Shopify.
The color of the circle to the left of the account name indicates whether the account is connected. Red means you need to connect, and green means the account is connected.
Take advantage of templates ⏩
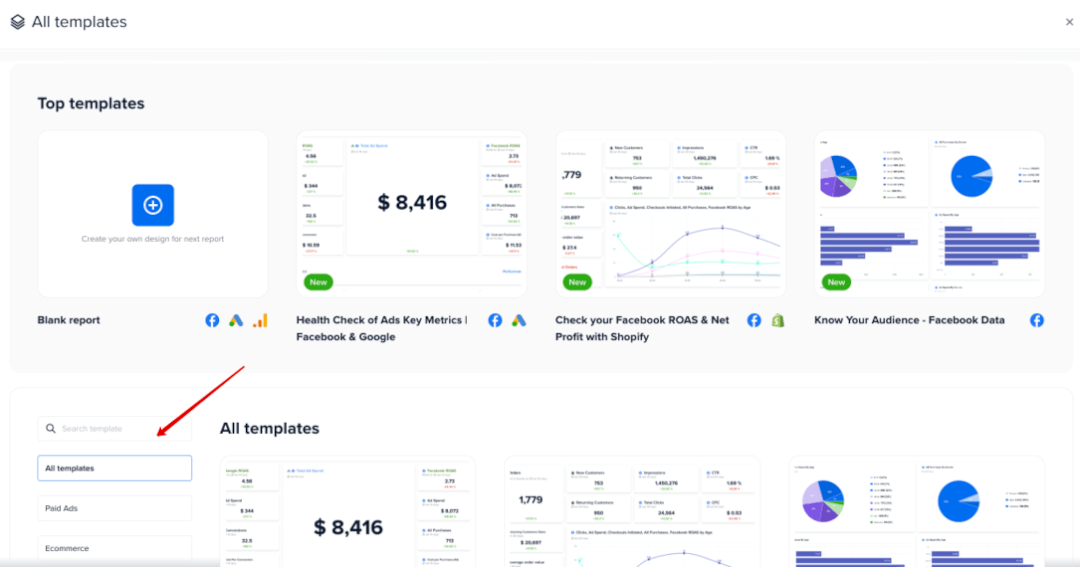
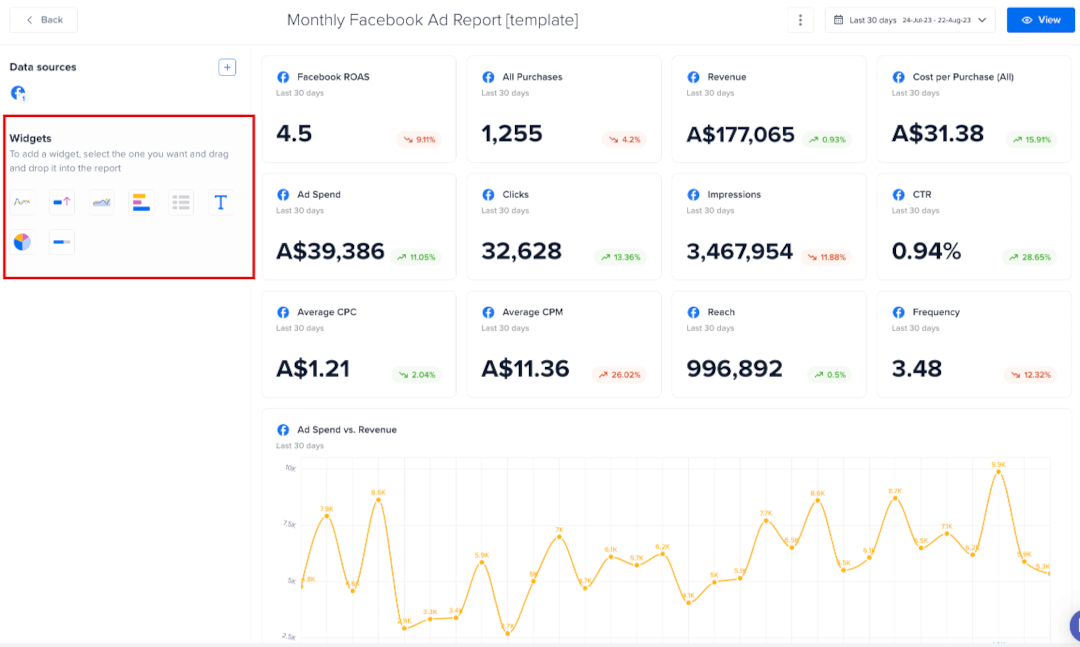
Click “Create Report,” and you will be offered a selection of multiple different templates that are based on the ones industry-leading marketing agencies create for their clients. The templates are designed to impress visually, showing all of the top optimization metrics that users look for: ROAS, ad spend, Cost Per Acquisition, Revenue, Cost Per Outbound Link, CTR, and CPM. Simply choose the metric most relevant to you and focus the time saved elsewhere.
You can choose one of our most used templates or create your own from scratch.
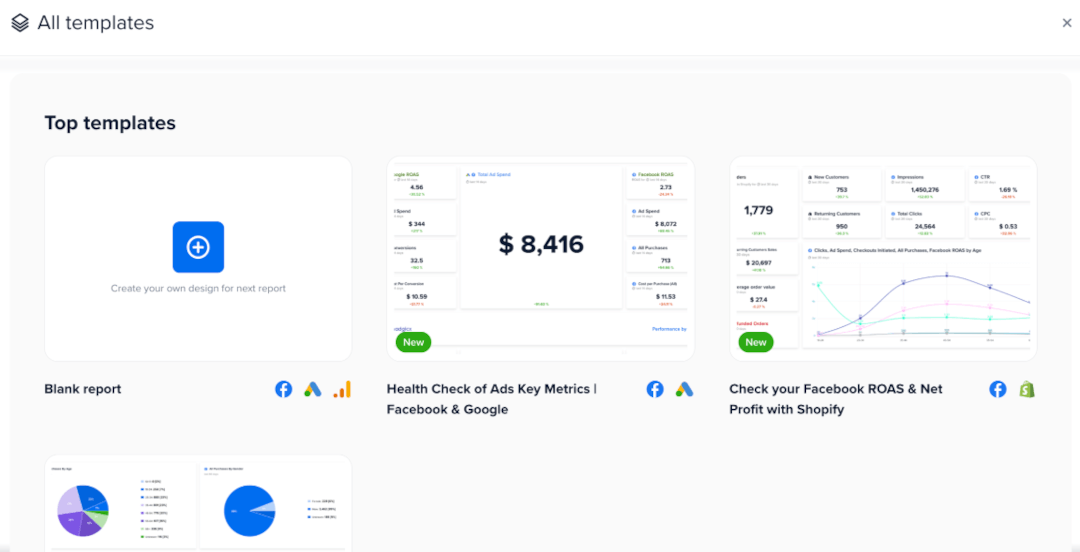
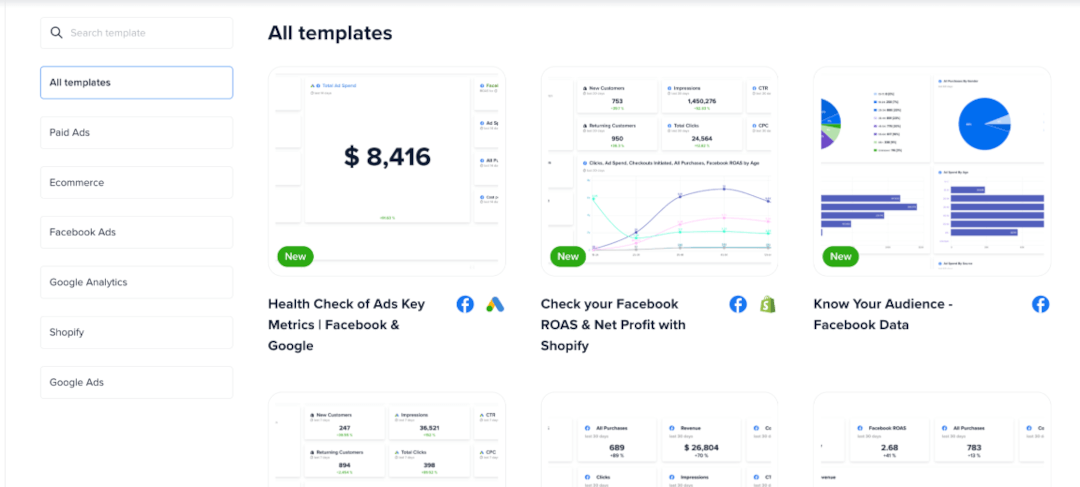
Or, you can browse through our template library to find a template for the data you want to show.
The templates are segmented based on channels and business type. These can be from individual platforms (e.g., just a report on your Facebook ads) or multi-channel (e.g., a report that includes data from Facebook, Google Ads, and Shopify).
Select a template depending on the questions you want the report to answer.
You can modify the reports, add and remove metrics, and even create your own report tailored to your needs from scratch. We’ll focus on how to modify a template to your needs.
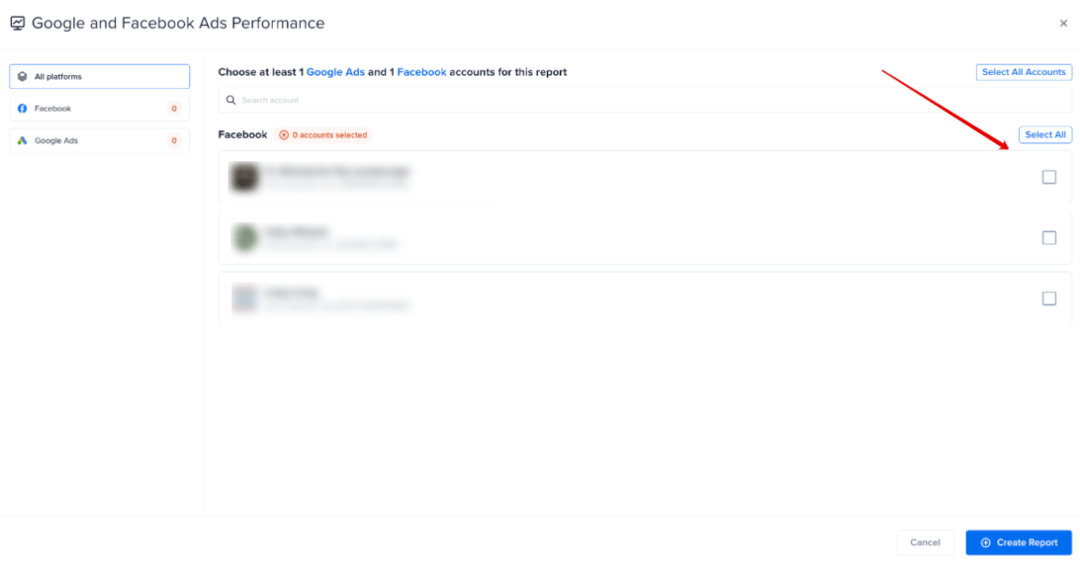
Once you have selected the template, choose the account(s) you want to generate a report for from the channel list on the left. Click “Create Report.”
Don’t forget to select the time frame you want for the report. For “Informer” widgets, the timeframe will be used to show the trend compared to the previous period.
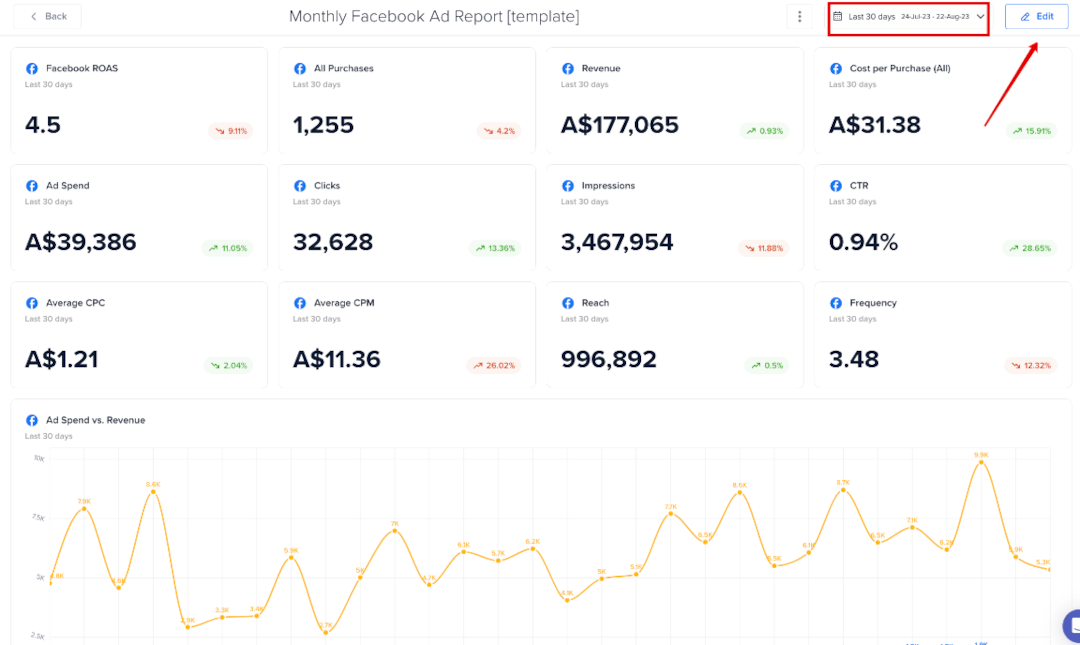
Let’s click the “Edit” button to customize the report.
NOTE: Click the “Edit” button at the top-right corner to add widgets to an existing report. If this button says “👁️ View,” you’re already in the editor.
Add or remove metrics ➕
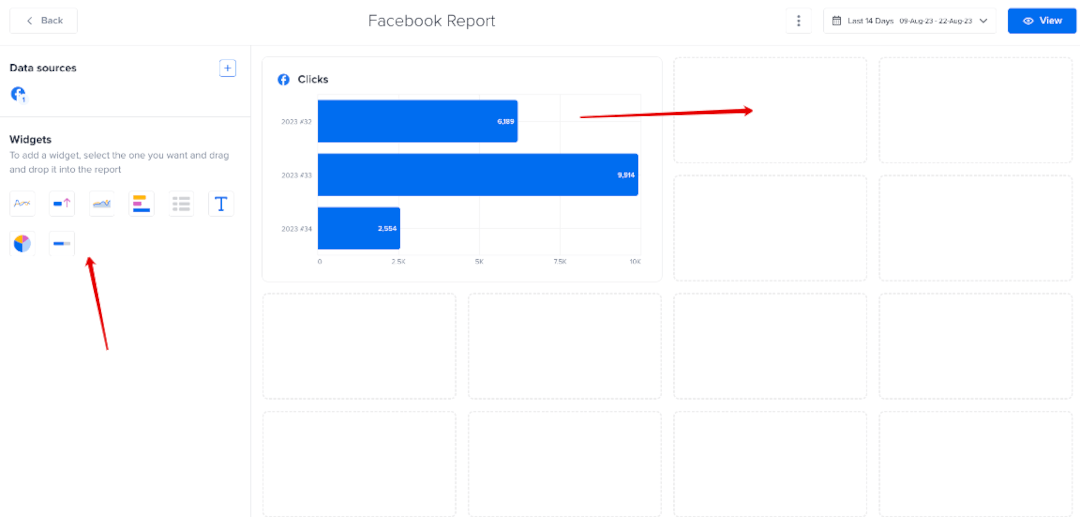
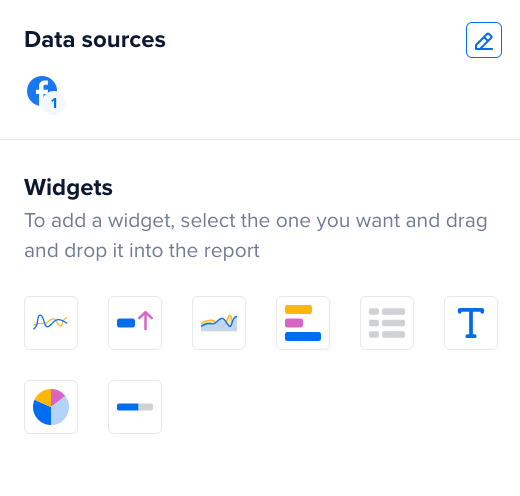
To add any additional metrics, simply drag and drop the widget of your choice from the column on the left to the template area on the right.
Or you can navigate lower to the white space at the bottom of the report, click the “+,” and drag and drop the widget you’d like to add. You can then modify your choice of metric and customize the charts.
You can also shuffle widgets around to suit your preferred placement.
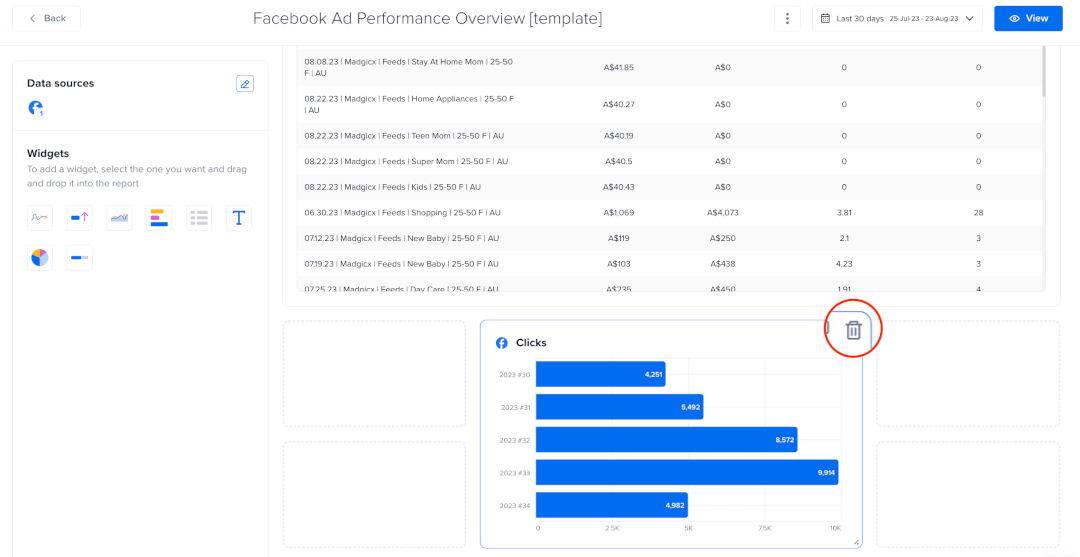
To delete a widget, hover over it and look for the trash icon in its top-right corner. Click it to remove the widget from the report.
Customize your charts 📊
You can change how the data you want to show is visualized, whether that be as one of several types of widgets:
- Line graph
- Informer
- Area graph
- Bar chart
- Table
- Custom text
- Pie chart
- Goal completion
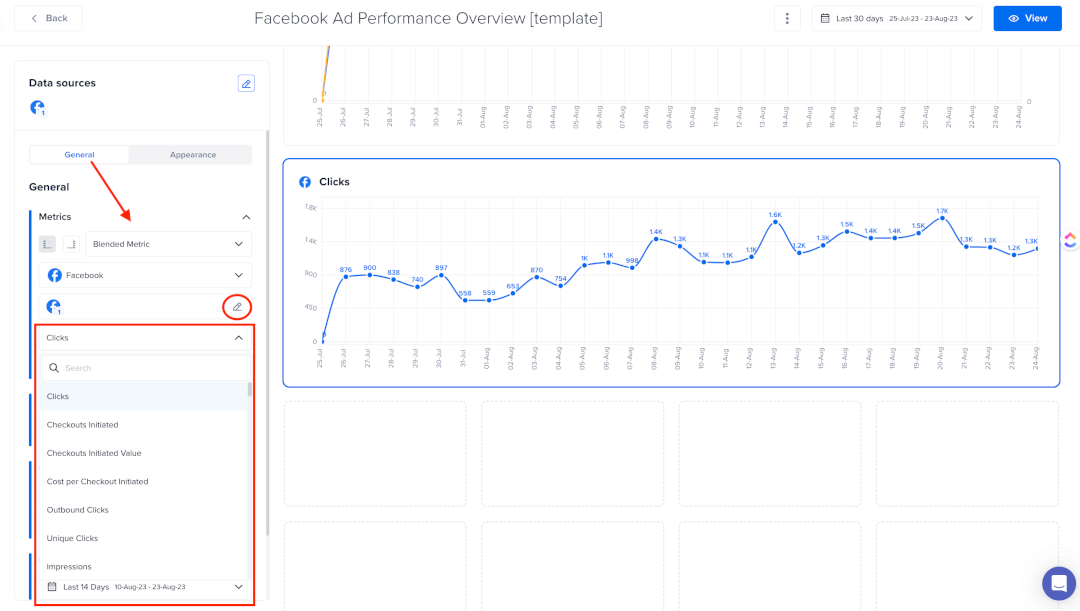
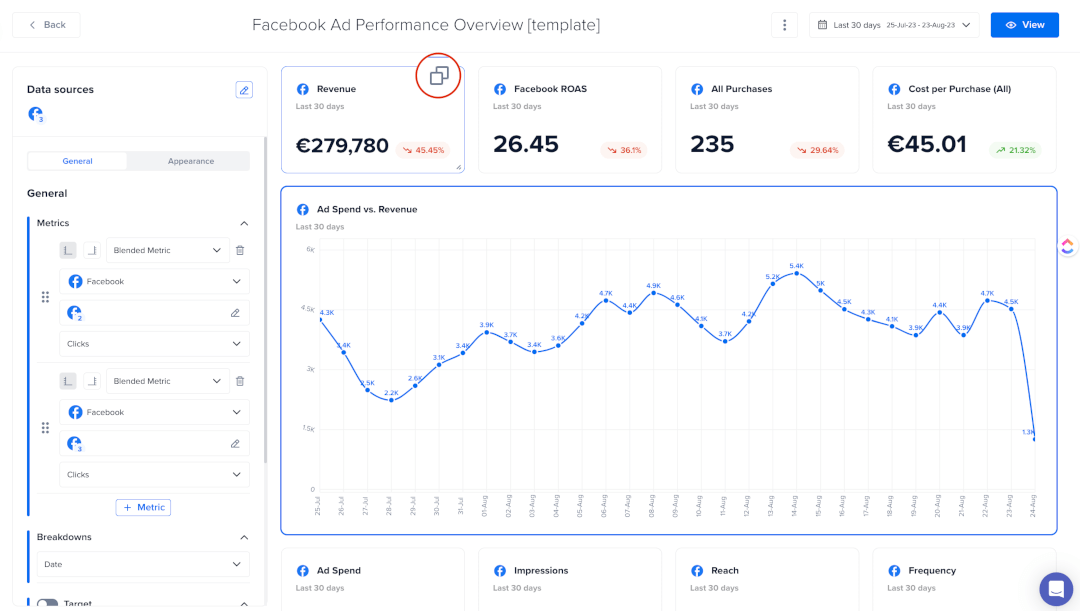
Set and change the metric for your chosen widget at any time in the General section of the left-hand sidebar. You can also change the title, subtitle, and appearance of each widget in this sidebar when switching to the “Appearance” tab. Make sure you click on the widget that you want to edit.
You can select a “Regular Metric” if you only want to see it for a single account or a “Blended Metric” if you want to monitor a metric across several accounts and channels. If you select a blended metric, add the relevant channels (Facebook, Google Ads, TikTok, or Shopify) and accounts.
Note: Madgicx supports custom conversions for Meta! You can find all the custom metrics you created on the metric list 🦸
Create reports for all your accounts 📝
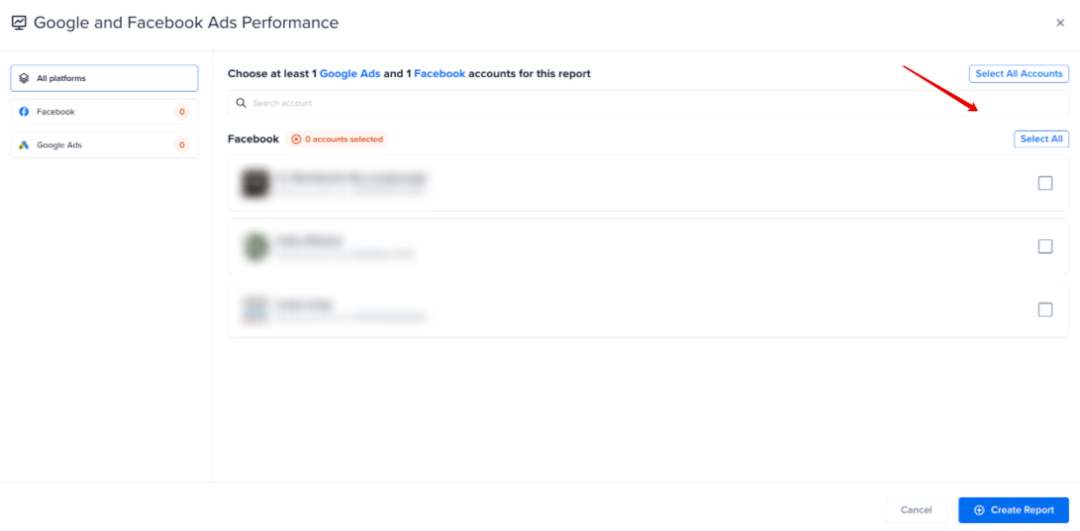
If you have several ad accounts connected to Madgicx, you can compare how each is doing against one another across set KPIs.
To compare accounts, select the accounts from the list and click the “Create Report” button in the bottom right.
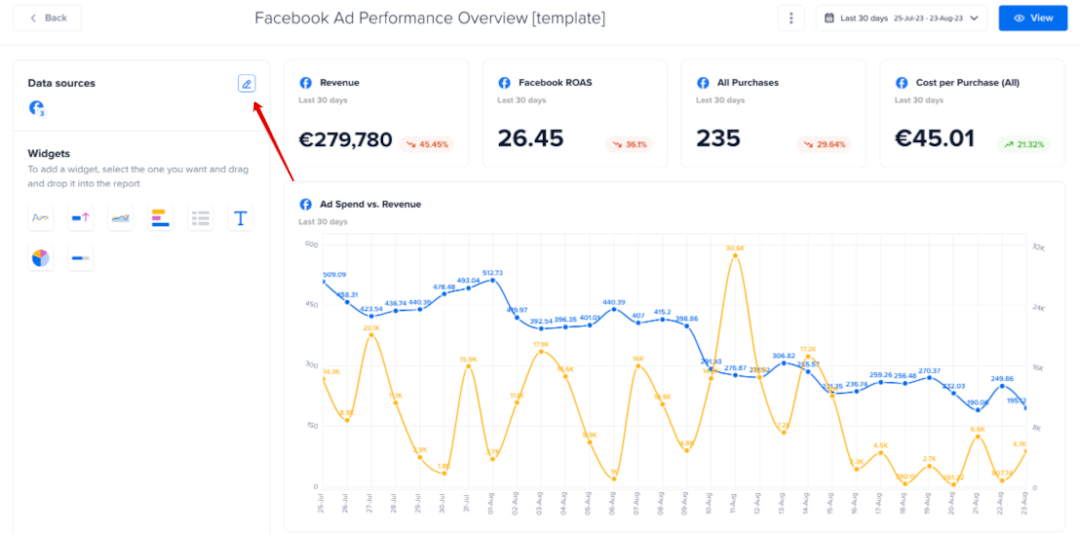
You can always add more accounts later on to see their performance against your chosen metrics. Just click on “Data sources” to add more accounts.
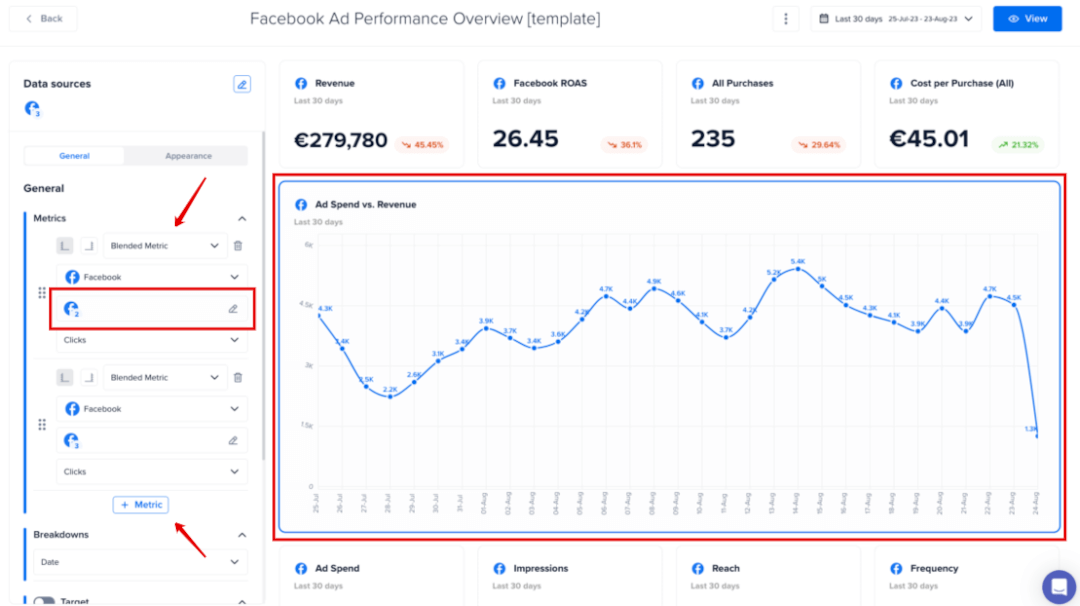
Then, select the accounts and the metrics you want to compare and choose the accounts you want to compare where you see the red rectangle on the left-hand side.
Duplicating widgets is another great feature that will save you time, and it’s super easy: just click the copy icon at the top right when you hover over the widget.
Share with whoever you need 🔗
Sharing the report has never been easier, and you can even share with people who don’t have access to Madgicx through a:
- Public link
- Downloadable PDF
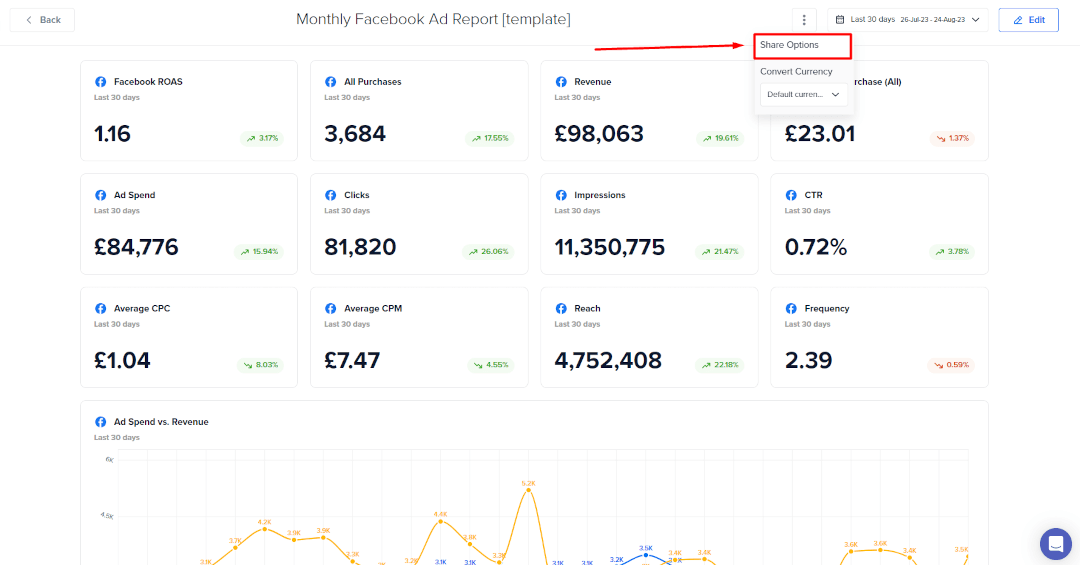
To share a report, click the three-dot icon at the top-right corner of your screen (whether in “View” or “Edit” mode) and select “Share Options.”
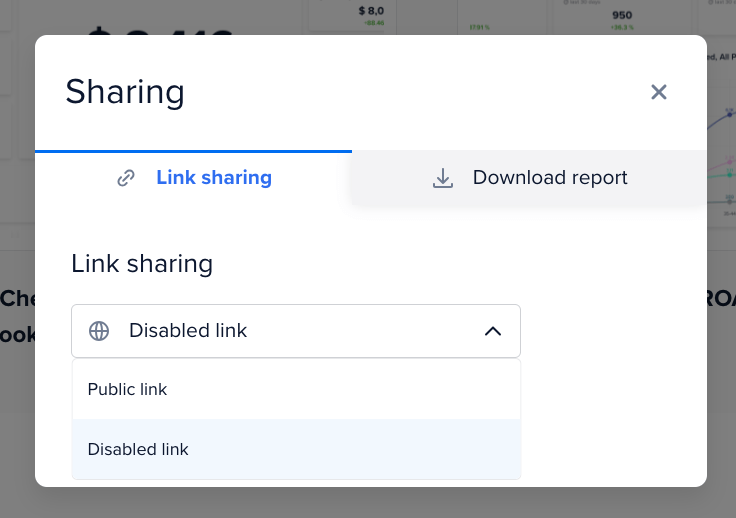
To share via a public link, use the dropdown menu in the “Link sharing” tab and change it from “Disabled link” to “Public link.” Then click “Copy link” and share it with whoever you want - even if they don’t use Madgicx. And the best part: they’ll always be able to view the report in real time as it updates!
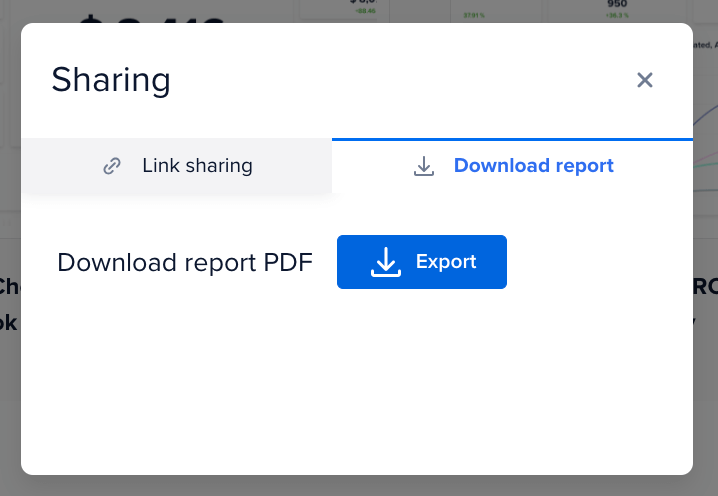
To download your report and send it to someone, switch to the “Download report” tab and click “Export.”
All of your reports get saved automatically, so you can load them up and see the data you want for the time frame you select at any point.
Which Madgicx plans include One-Click Report?
One-Click Report is available for all users. You get 5 reports in the free trial.
You can purchase One-Click Report as a standalone tool with prices starting from just $29 per month.
How can I save a specific report?
Reports save automatically.
How can I add more metrics?
You can add more metrics to a report by navigating to the bottom in the editor and clicking on one of the empty spaces, in which a plus sign should appear. Then select what visualization you would like for the metric and set up the widget as you please.
Can I request templates?
If there is a certain template you’re missing, you can either create it yourself and it saves automatically, or you can submit a feature request.
Can I use my company’s design for the report (white-label)?
Not at the moment, but this feature could be included in future updates. You can always check out our latest releases and subscribe for updates there to be informed when we add this feature and others. Also, we’d love to hear of any other feature suggestions that would make Madgicx better for you.
The KPI that I want to select is not available. What should I do?
Can I view multiple Google/Meta/TikTok/Shopify accounts in a single report?
Sure! You can connect as many accounts as you need to Madgicx and then authenticate them for One-Click Report.
Is goal completion available for all metrics?
Goal completion is only available for metrics that can be summarized, for example: clicks, ad spend, purchases, etc. and not for ROAS, MER, or conversion rates.
Can I export data from One-Click Report to share with my clients?
Sure. You can download the report as a PDF.
I have an error message, what should I do?
Reauthenticate the relevant account in the “Data Sources” tab and try loading the report again.
Can I automate or schedule the sending of One-Click Reports?
At this stage, we don’t have a feature to automate the sending of One-Click Reports. You can easily generate a public link for each report in One-Click Report, where anyone can view it and see the data in real-time. We recommend familiarizing yourself with the One-Click Report features so you can fully utilize this tool to your advantage.
See data from different channels and combine it for a better understanding of overall performance, including:
- MER: total revenue divided by total spend
- Net profit tracking: e-shop revenue minus ad spend and COGS
- Set and view goals and baseline targets
%20(1).jpg)
Didn't find what you were looking for?
Try our FAQ
Check out the answers to our most frequently asked questions. If you can’t find the answer there, you’ll be able to contact our support team.