How to use Madgicx's Meta Dashboard (formerly Facebook Dashboard)
With Madgicx’s Meta Dashboard, you can:
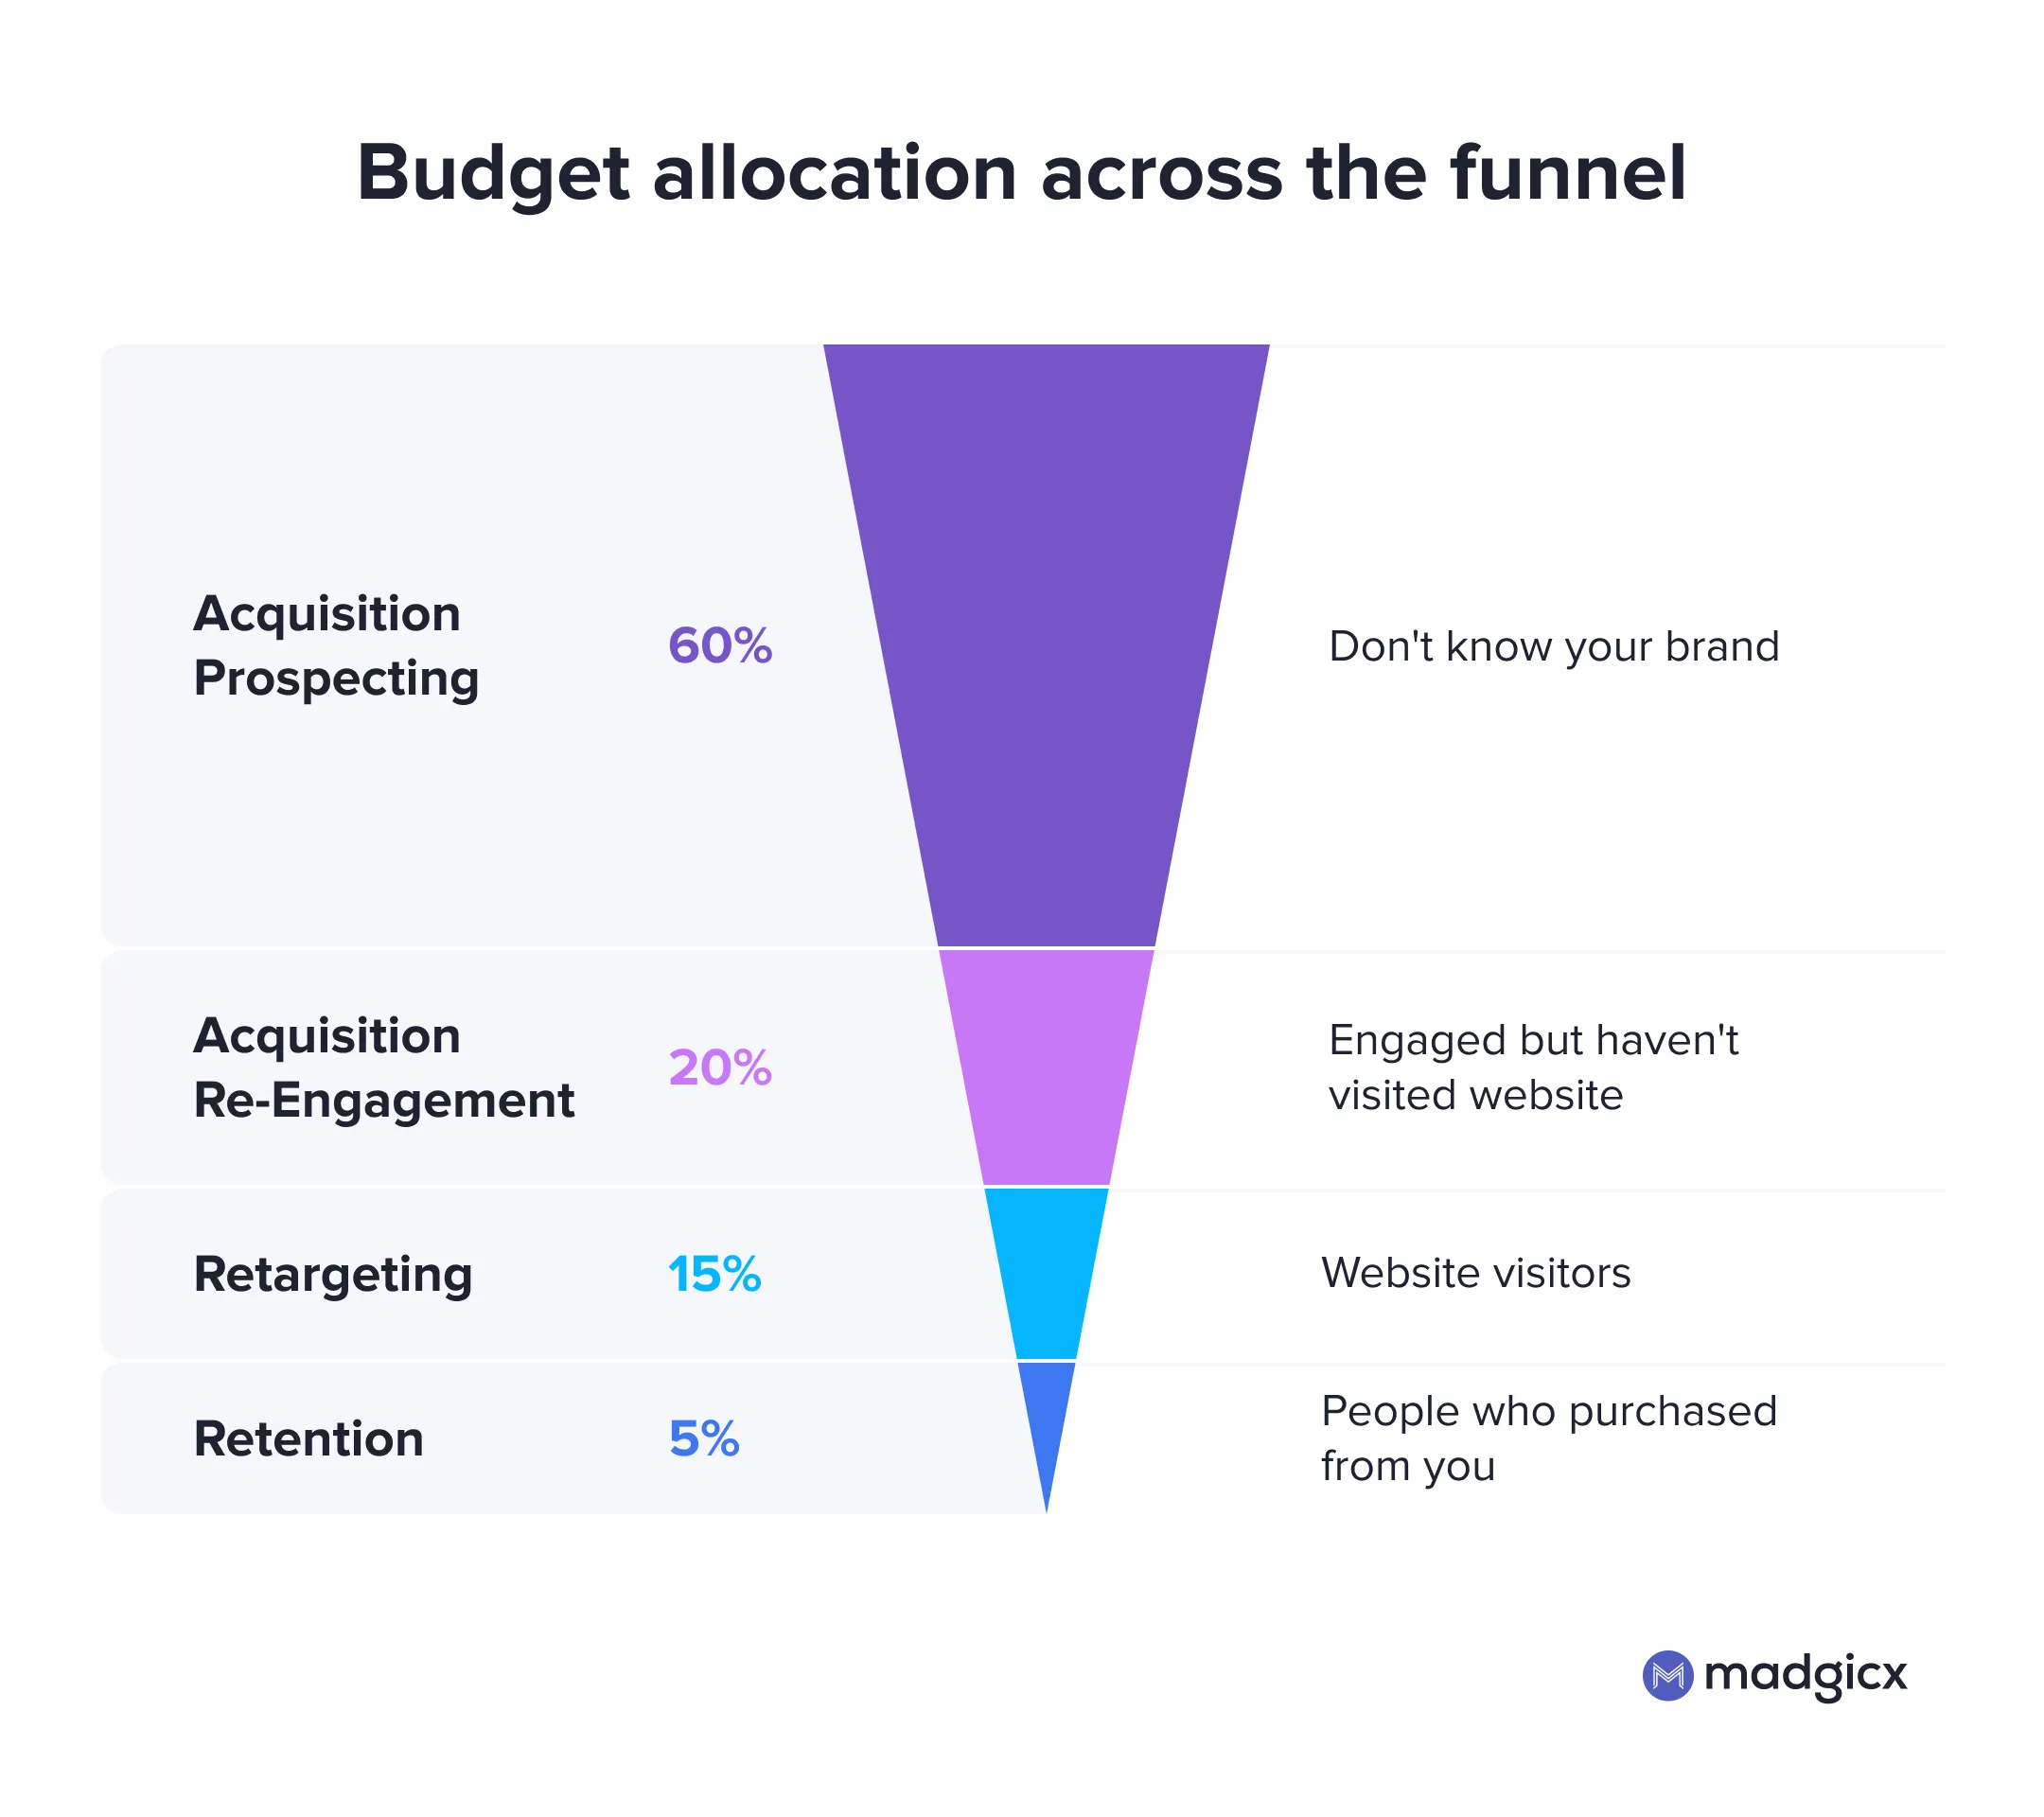
- Ensure you cover your entire marketing funnel from acquisition to retention
- Strategize your budget allocation across the funnel based on performance
- Automate performance reporting and have them sent right to your inbox


Madgicx’s Meta Dashboard (previously Facebook Dashboard) is your ad account’s cockpit: where you get an overview of your Facebook advertising strategy.
Throughout your ad strategy, you need to understand your current performance and the results you want to see. The dashboard shows you how each part of your marketing funnel is performing so that you can adjust your strategy to achieve the desired results.
When you land on the dashboard, you are looking at your marketing funnel and can see how it is doing. You can find the Meta Dashboard on the 360° Meta Audit page in the menu at the top of the screen.
PRO TIP: In e-com, acquisition audiences should take up most of your budget — about 70%–80%. Retargeting should spend around 15%-20% and retention around 5%-10%. This is because you want to find and acquire more new customers to expand your business, not just rely on repeat purchases. Plus, too much retargeting will lead to audiences drying out with too few new people coming in from acquisition. It’s important to know that every account is unique, so you need to be able to analyze your account to see what budget allocation works best for you.
Examples of metrics for different parts of the funnel
You can use metrics that are applicable throughout all of your funnel. For e-com business, our pro media buyers recommend the following setup:
- Amount Spent
- Cost per Checkout Initiated
- Cost per Website Add to Cart
- Cost per Purchase (All)
- Unique Outbound Clicks
- Outbound CTR
- ROAS
- Offline Purchases
If you’re in the lead generation business, you can use Leads, Cost per Lead, etc.
You can also use a whole range of metrics depending on your goal. Below we have split some of the metrics according to the general concept of sales funnel stages:
Top-of-the-funnel (ToFu) metrics relate to the first time the prospect interacts with your ads and these metrics are relevant to see how your acquisition-prospecting strategies are doing. From the examples above, we can see that the metrics are about eyeballs on our ads and some clicks.
Middle-of-the-funnel (MoFu) metrics are relevant for those much closer to making a purchase and can be relevant to assess how your acquisition re-engagement strategies are doing. Here we have metrics where the prospect is interacting with your business and almost over the line.
Bottom-of-the-funnel (BoFu) metrics are about conversions — where the purchases are at. These metrics concern retargeting and retention because these parts of the funnel are more about purchases, but can also be about acquisition prospecting and re-engagement if you have a really strong product or really well converting ads.
Get immediate insight 🕵️
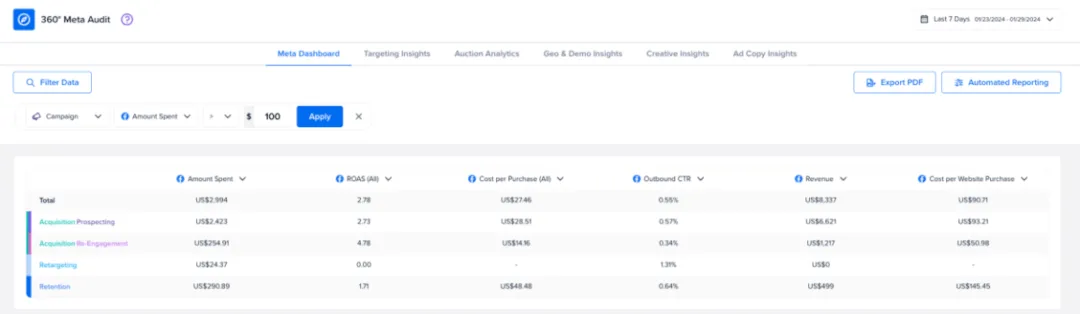
Open the dashboard from the 360° Meta Audit page, and you can get an immediate overview of your ad account. Madgicx automatically segments your campaigns and ad sets according to their funnel stages.
As always, set the time frame and KPI you want to see data for.
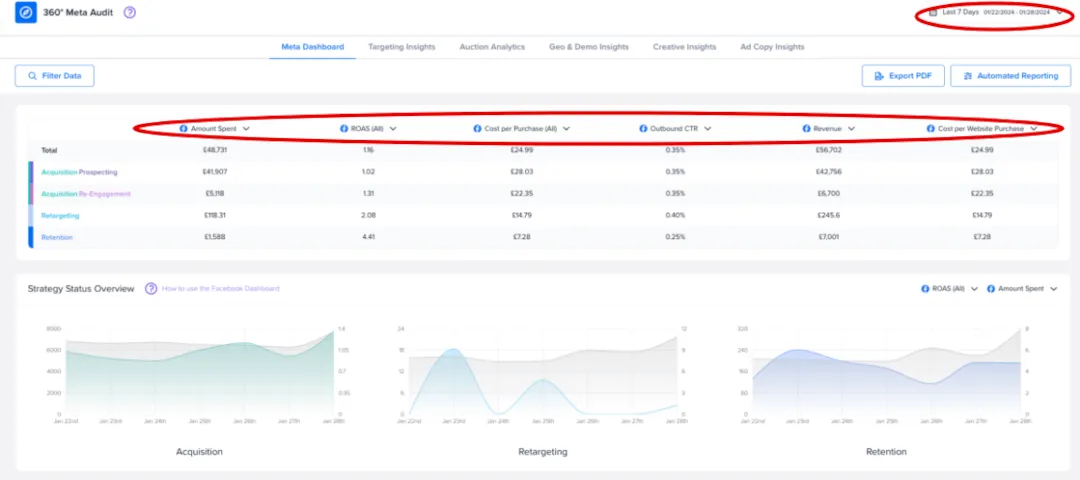
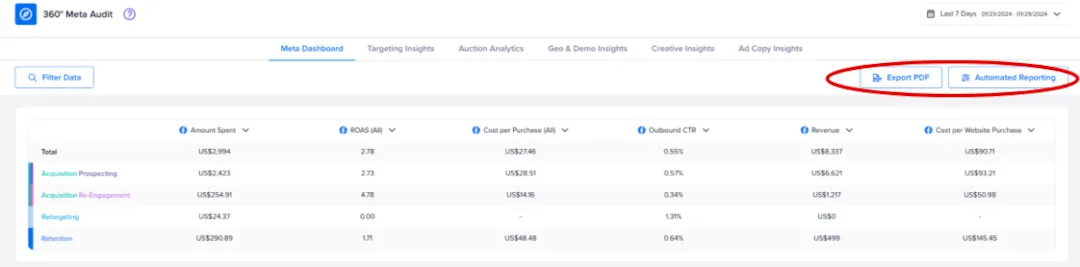
For the account below, we can see in seconds that it is missing a retargeting strategy.
From here, we can use this knowledge to launch ads for retargeting using Madgicx’s Audience Launcher.
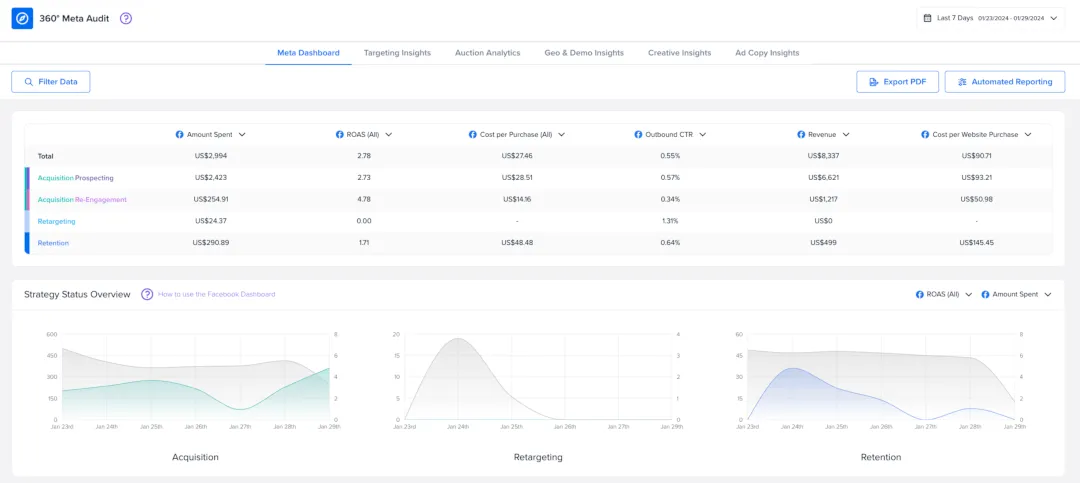
Now, if we look at the Meta Dashboard for the account below, we can see that the ad spend is generating mediocre returns across the entire funnel, except Re-Engagement which has a great ROAS of 4.78.
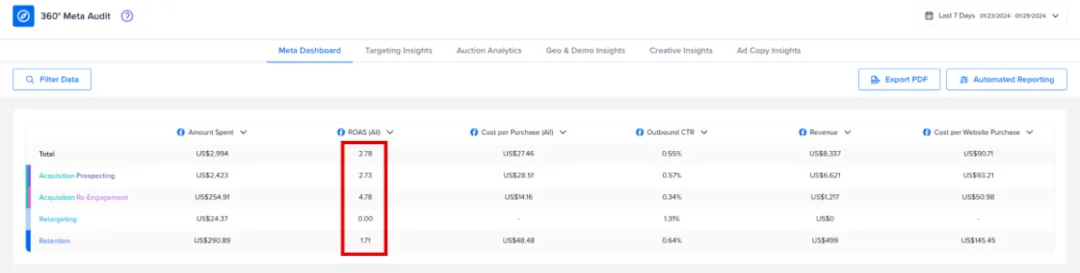
The Madgicx Meta Dashboard is meant precisely to give you this immediate overview of what is going on so that you can see where your advertising efforts are bringing spikes or drops in your results.
See specific breakdowns 👀
This dashboard shows you the state of your ad efforts right now, and you need to make decisions based on that data.
Here you can see how the actions you take to optimize at one part of the funnel impact another part of the funnel.
In addition, the graphs lower down on the dashboard give you a quick visual overview into your performance across KPI, funnel stage, and revenue vs spend.
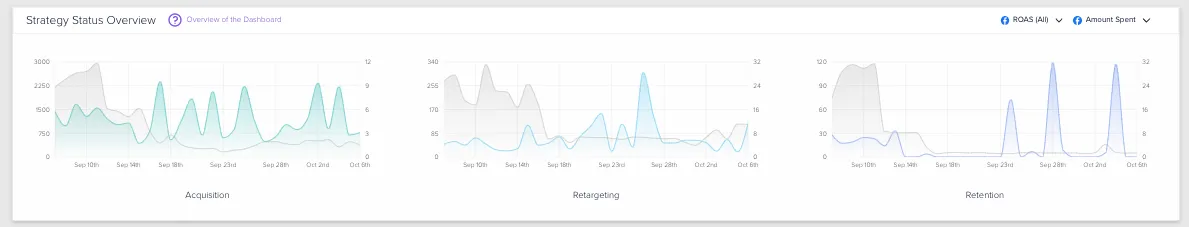
Strategy Status Overview
Strategy Status Overview allows you to compare your top KPIs and monitor your funnel-stage performance over time. Use the dropdown arrows to see different metrics and customize your preferences.
You can use it to compare two metrics, identify overspending, or analyze scaling over time. For example, tracking metrics such as ROAS and Amount Spent over the last month can give you insights about the “sweet spot” for that funnel stage or the optimal way to scale your ads.
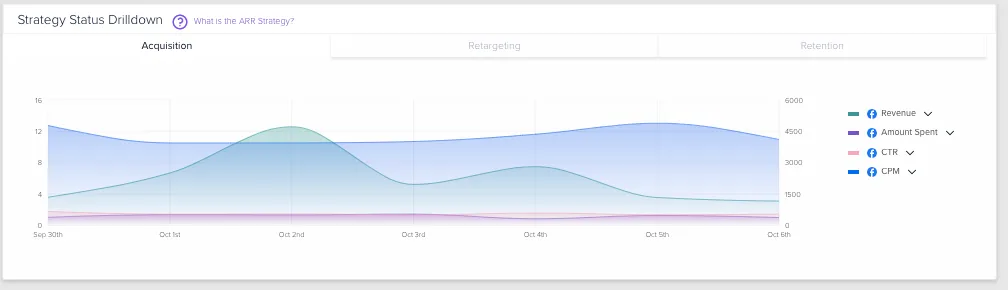
Strategy Status Drilldown
Strategy Status Drilldown can help you determine which metrics are driving a change in performance. The three tabs on top let you compare metrics for each funnel stage.
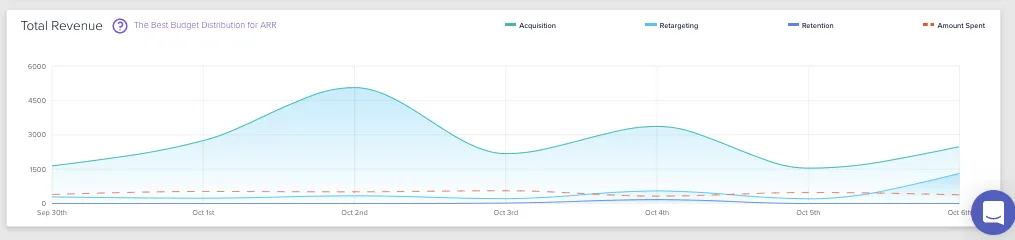
Total Revenue
Total Revenue widget displays your aggregated revenue for the selected time frame. Here you can also compare how different funnel stages are performing against one another.
Automate reporting 📈
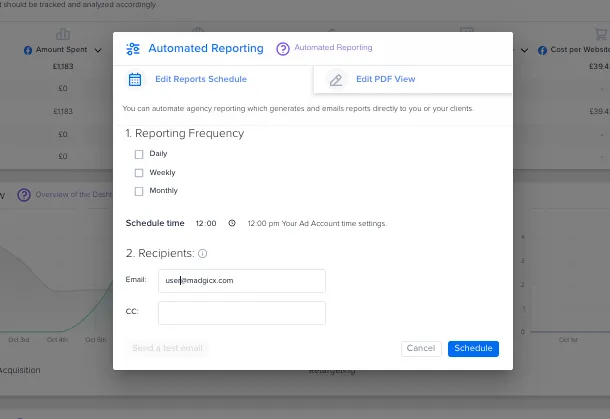
Pull a report as a pdf that you can then share or set up automated reporting to get insights sent straight to you or your client on a regular basis.
We don’t recommend sending your clients or daily reports since ad performance can be volatile. If results for any given day aren’t meeting performance targets, this may be something they don’t take well. Sending reports on a weekly or monthly basis will give a better overview of general performance.
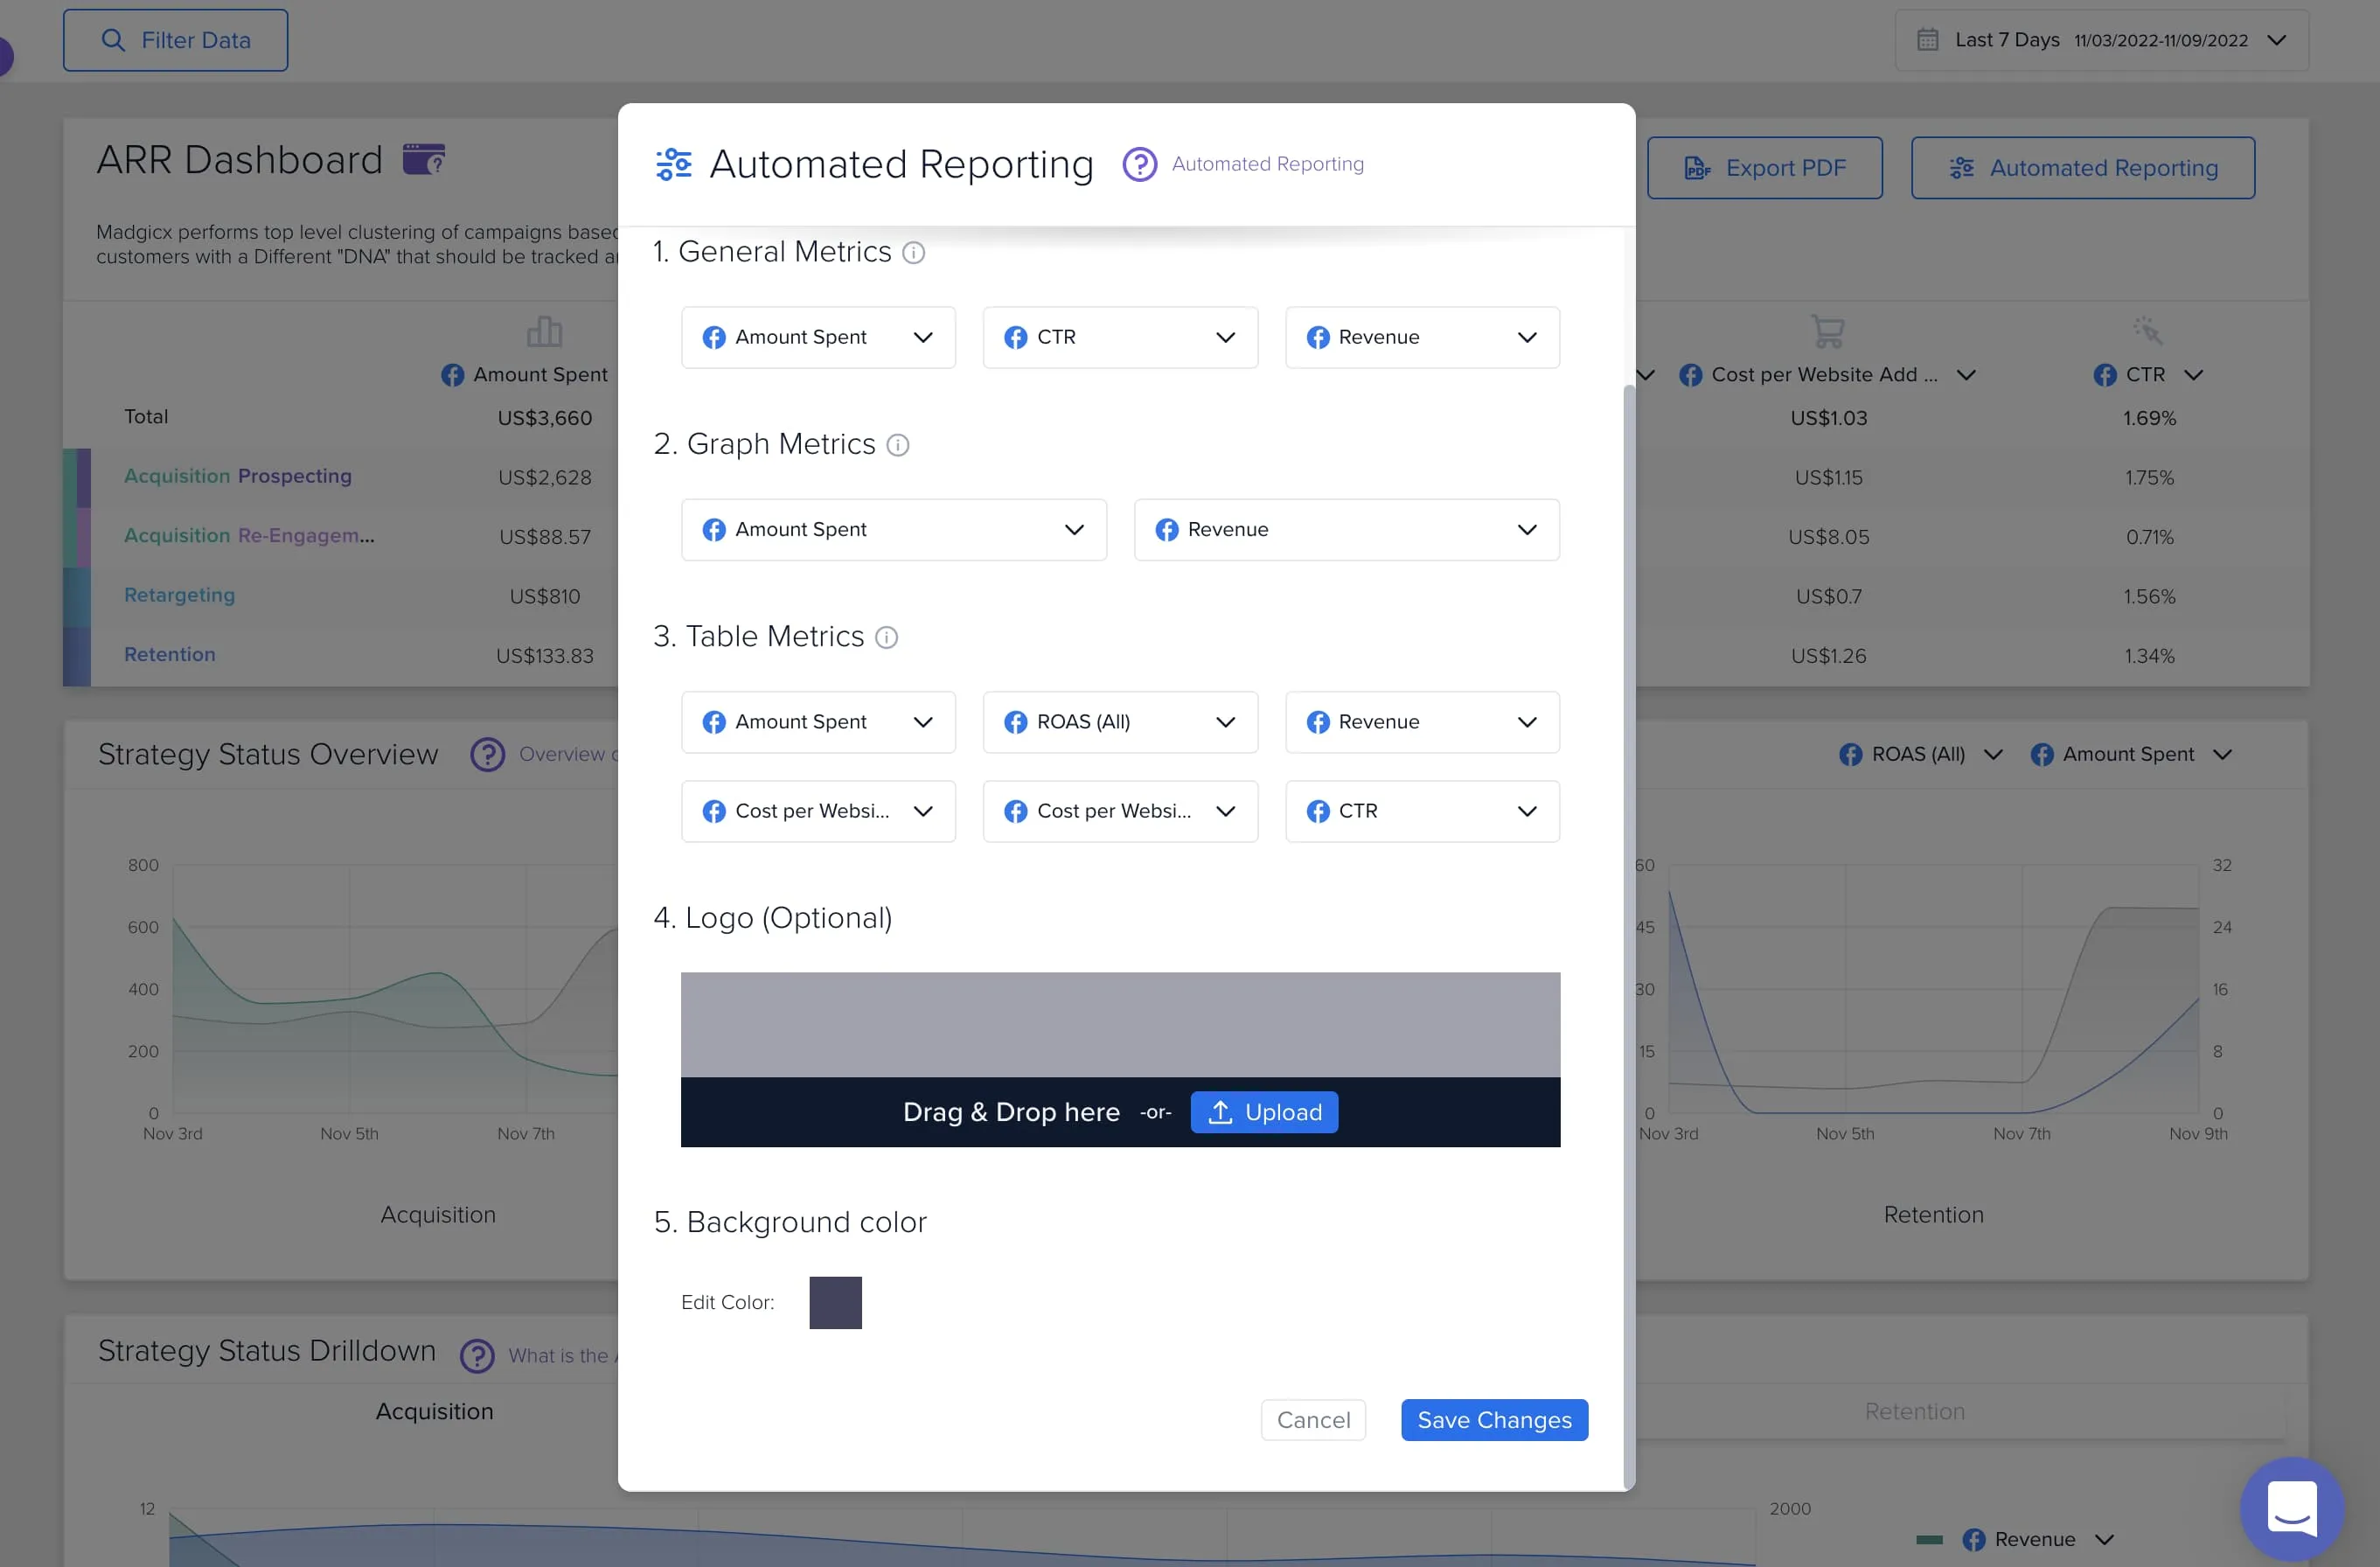
Customize and white label ✏️
You can edit the metrics you want to show in the report to tailor them to your business’ needs. Moreover, you can white label the report with your logo and select a background color according to your brand guidelines. To do so, just drag and drop your logo into the relevant section.
Difference with Facebook Ads Manager
Madgicx’s Meta Dashboard makes you a better media buyer because it saves you time with data views that are not shown in Facebook Ad Manager.
I can’t see a specific metric (KPI) in the dashboard
If you can’t see a metric you’re looking for on the Dashboard, click the small black arrow to open the dropdown list and reveal all metrics. You can use the search function to find the metric you are looking for.

Why can’t I see the graph for acquisition/retargeting/retention?
If you can’t see your analytics for a certain funnel stage, it’s likely that your account never engaged in that funnel stage, so it has no data to show on the dashboard.
The KPI that I want to select is not available in One-Click Report. What should I do?
How can I see results from today?
The dashboard shows your performance depending on the date range you select. To see today’s data, manually select a date range to include today's date.

Note: Time frames of Last n Days do not include the same day. To see today's data, manually pick the time frame to the last n days including today.
Can I use the Meta Dashboard (formerly Facebook Dashboard) to create reports for my clients?
Sure, you can even automate the reports you send and white label them with your branding:
Does audience size matter?
Audience size is a delicate issue because the solution tends to be unique for each user's needs. It refers to the number of potential customers who could see your ad. The right audience size depends on your campaign goals and the stage in your marketing funnel.
We want to focus mainly on the top of the funnel (acquisition) for users just starting.
We aim to drive a large pool of potential customers to our site and convert them into paying customers. We want to continue to grow this audience until we have a large enough group in our retargeting segment.
Once we see a significant increase in traffic and pixel data, we reallocate our spending to retargeting and, eventually retention audiences.
Once the retargeting segment is large enough, you split the spending allocation close to 70% acquisition and 30% retargeting and retention. Again - this is usually different for every ad account, but 70/30 tends to be a good split.
Ultimately, it doesn't matter how big or expensive an audience is or how many times you reach that audience as long as the ROAS is where you want it to be.
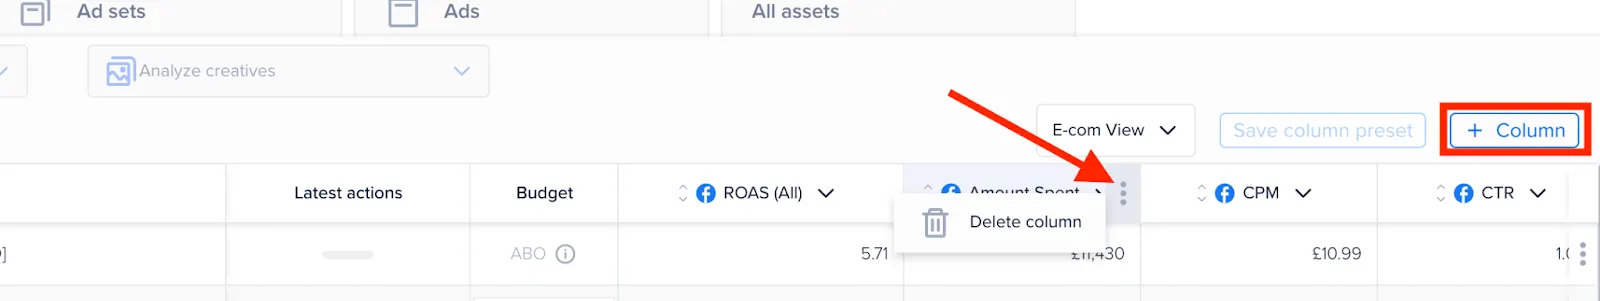
How do I customize the metrics?
Customize which metrics you see by clicking on the down arrow next to the name of the metric in the top row of the column.
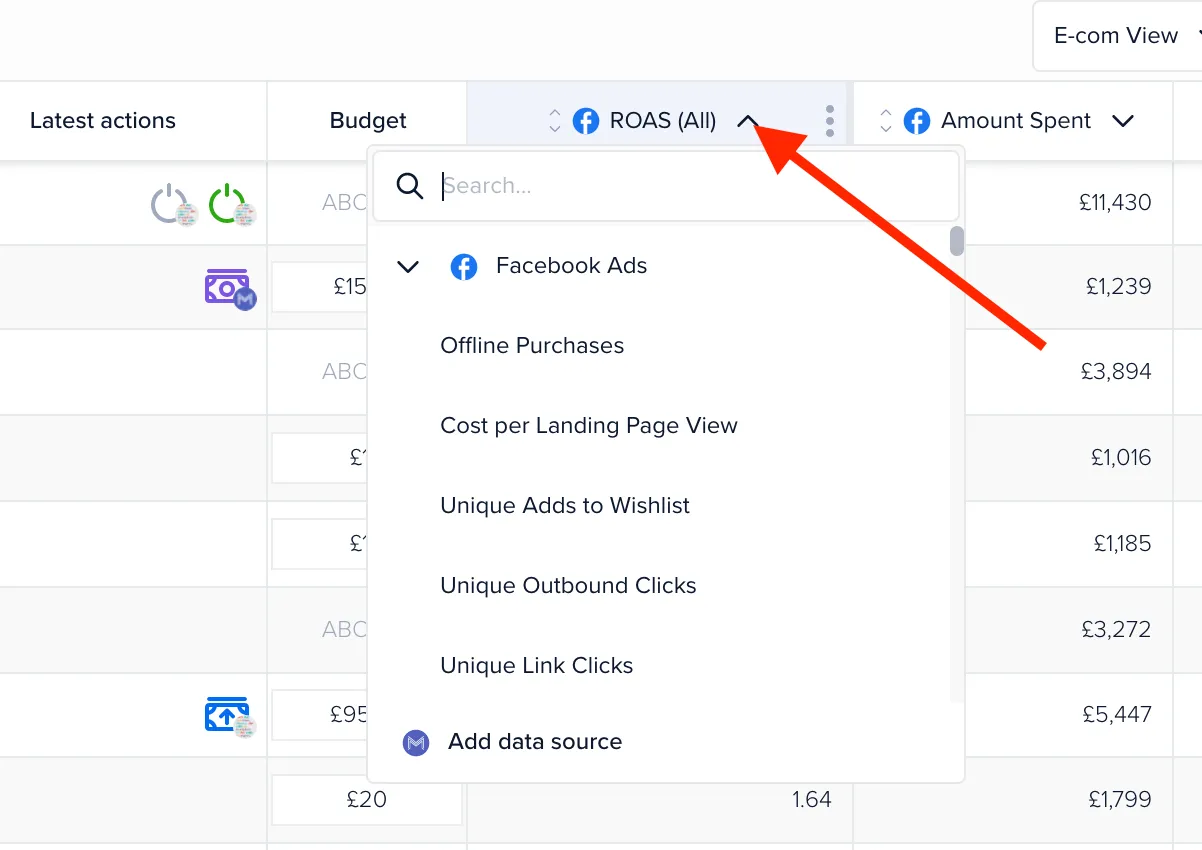
This will open a list from which you can search and choose.
You can also add and delete columns to display more metrics.
Create your own multi-channel performance dashboard with One-Click Report
Related lessons


Didn't find what you were looking for?
Try our FAQ
Check out the answers to our most frequently asked questions. If you can’t find the answer there, you’ll be able to contact our support team.