How to pick your One-Click Report template

If you’ve just started using One-Click Report, you may wonder which report will be most meaningful to you. This article will help you choose wisely so you can access meaningful data about your business and see the true power of this reporting tool.
Choose the best reports for your type of business
Whether you’re an e-commerce business selling digital or physical products, a lead generation business offering professional services, or an agency managing multiple client accounts, we have prebuilt report templates to suit your unique needs. In this article, we’ll review the best Madgicx prebuilt report templates for e-commerce, lead-generation businesses, and agencies.
E-commerce
- Business Dashboard
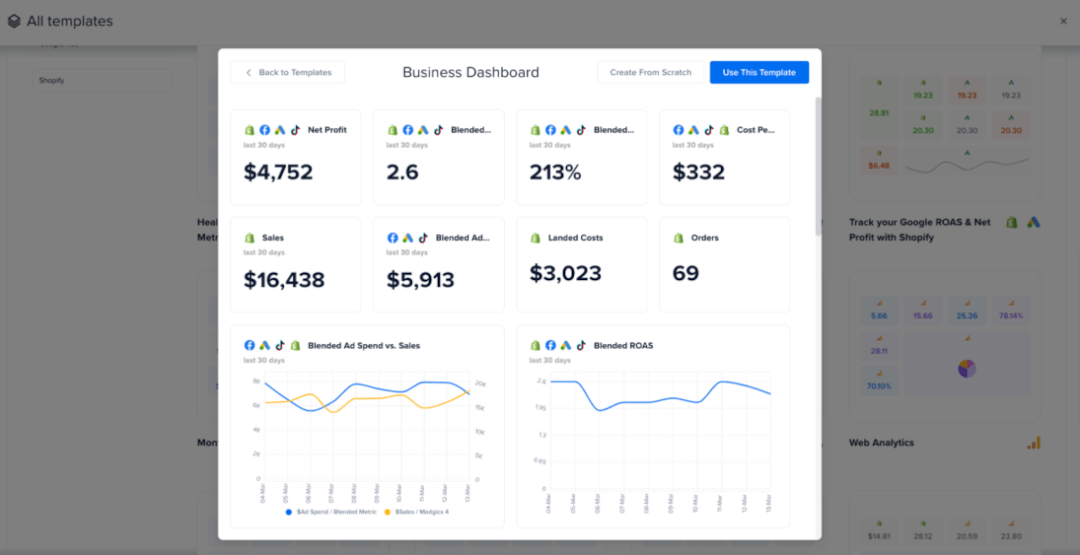
This super-handy report gives you an overview of your multi-channel business performance on one page. It’s a great place to start. Find the Business Dashboard template in ‘All Templates’ and click ‘Use This Template.’
In the next screen, you’ll be asked to select the data sources for this report. You can choose them by platform. Then click ‘Create Report.’
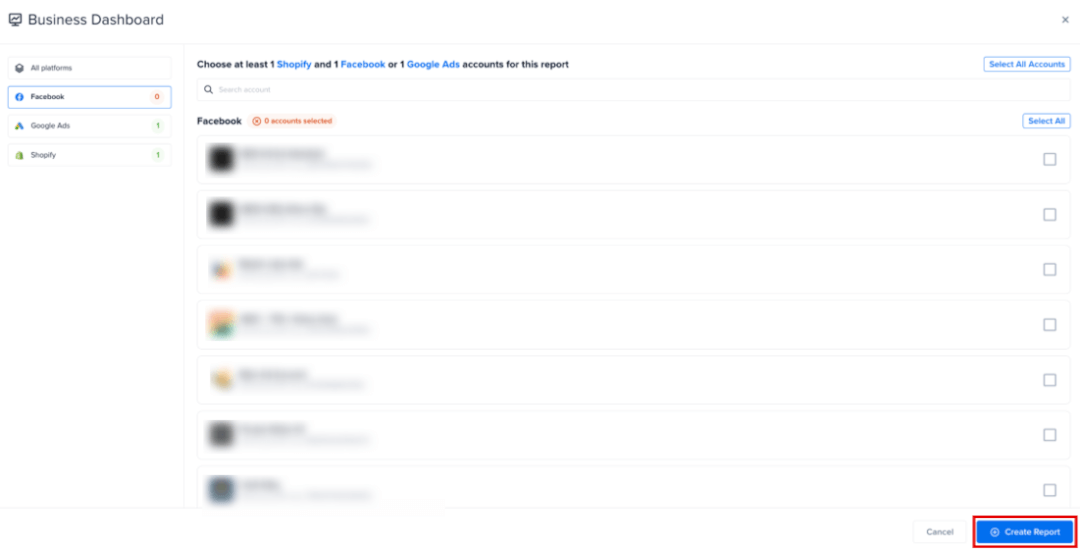
Depending on the amount of data, your report will take a minute or two to populate.


The Business Dashboard gives you a report on your business's status quo. It uses metrics from Facebook, Shopify, and Google to provide a detailed snapshot of your company.
Lead generation
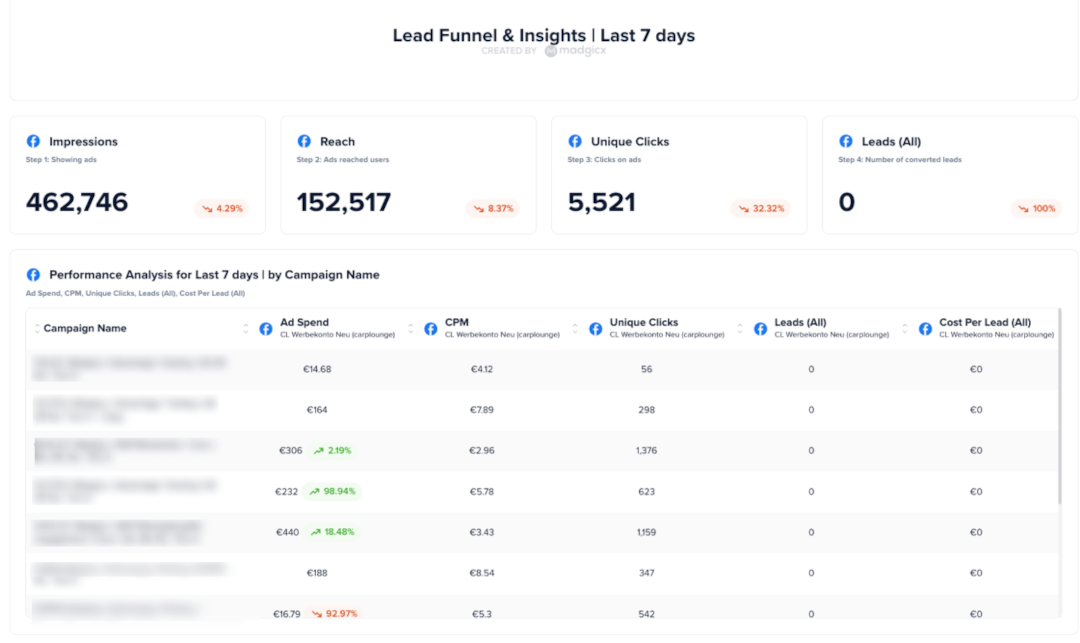
- Lead Gen Brand - Ultimate Meta Ads Performance
This report template is lead-centric for businesses that rely on lead generation. Once you’ve found it in ‘All templates, ' click ‘Use This Template. '
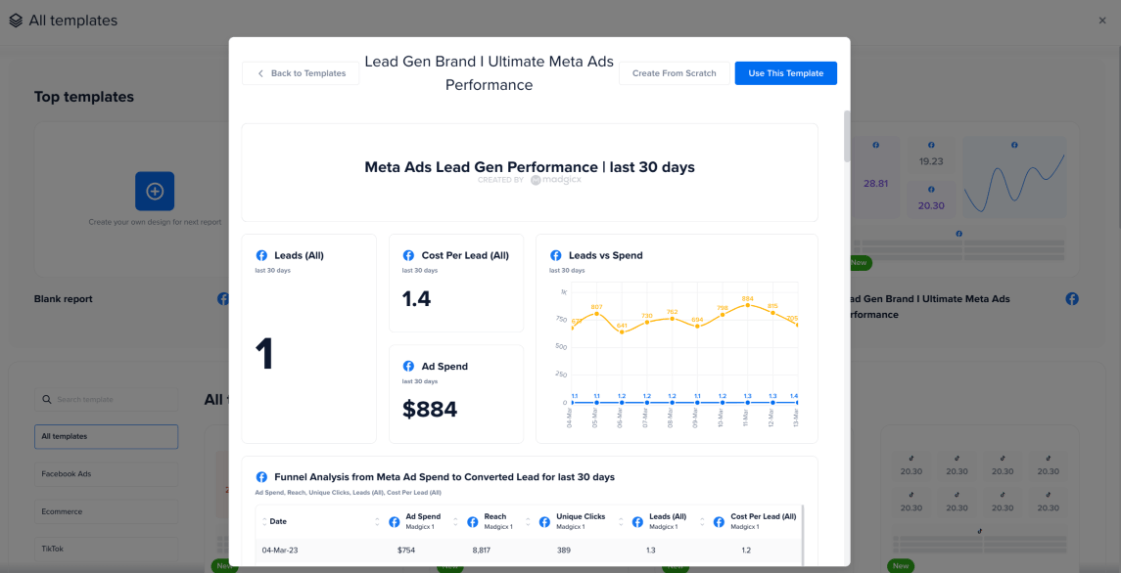
It breaks down your ad performance using lead-generation metrics and can indicate trends when analyzing and comparing results.
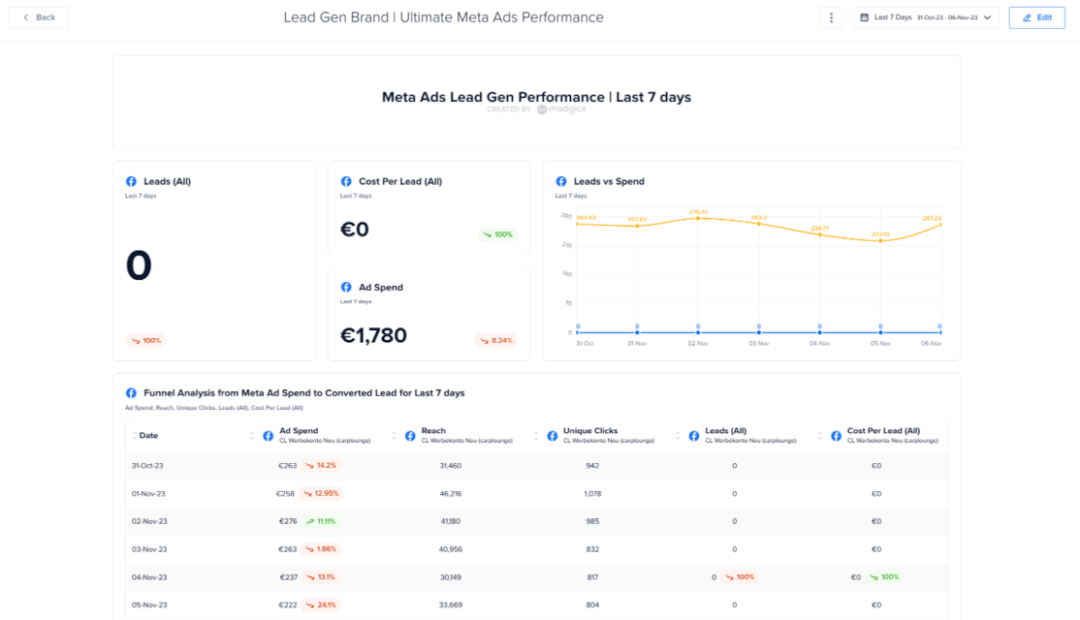
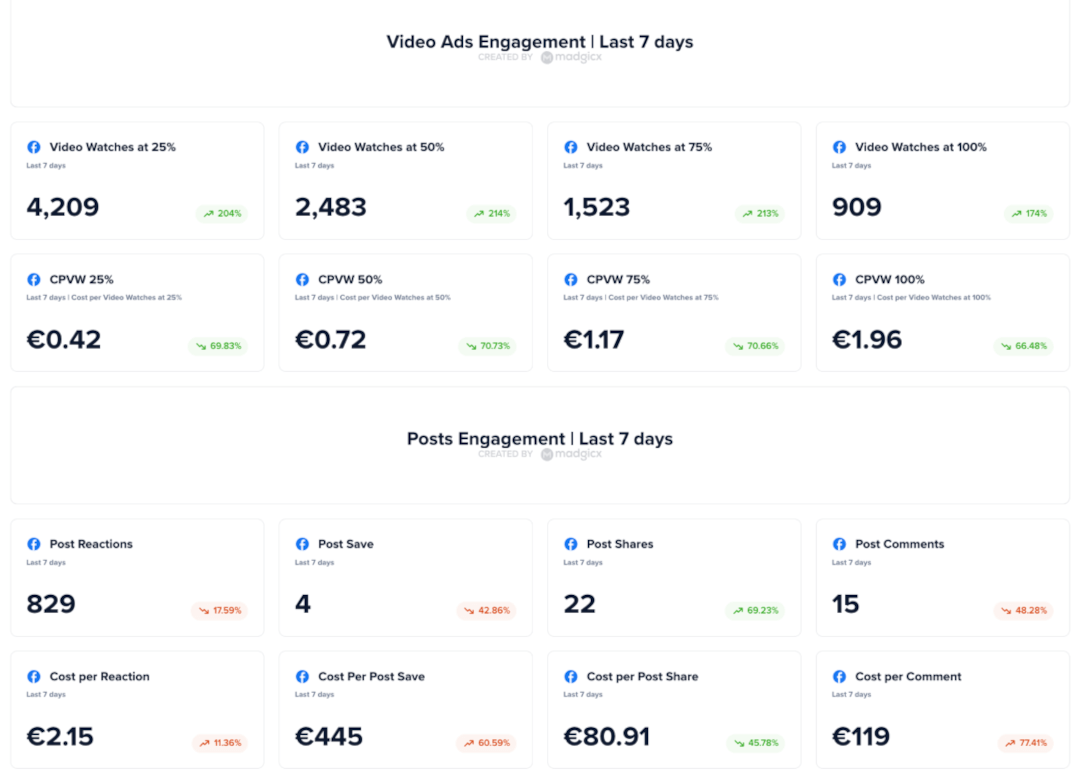
This template also allows you to view more details about how your lead funnel is performing based on your campaigns.
Monitoring engagement is vital if you’re focused on generating leads, as post or ad interactions could provide additional opportunities to connect with your audience.
Agencies
- Monthly Facebook Ad Report
This monthly report gives you the low-down on your Facebook ad performance. The template includes data from the last 30 days, including ROAS, website sales, and revenue, your cost metrics, and all your engagement data, including clicks, impressions, and reach, as well as your CTR and frequency.
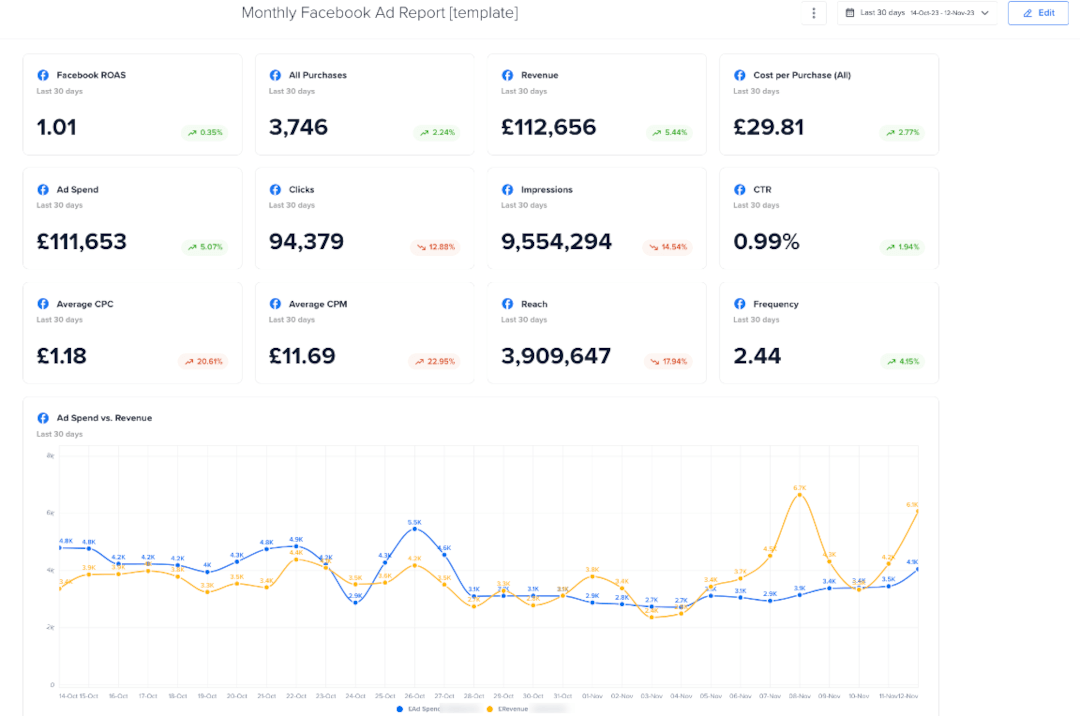
Scroll down, and you’ll see graphs comparing key metrics like ad spend versus revenue, clicks versus reach, and ROAS.

Furthermore, you can easily edit these settings, add or remove widgets, or change your metrics from regular to blended to incorporate additional accounts. This allows you to have a consolidated view of a portfolio of client accounts or all the accounts you manage in one report.
Below is an example of a customized report that includes the main metrics on each line and each time frame next to it so you can easily see the progress.

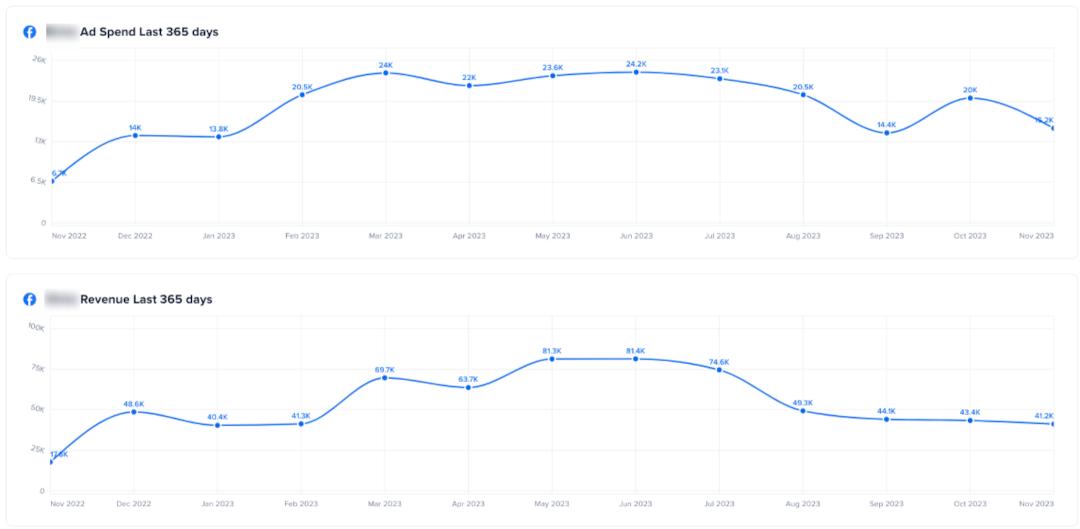
In this report, each agency client is included with the above metrics. You can do the same by adding more metrics and connecting the relevant data sources.
One-Click Report: Tips, hints, and tricks
If you haven’t already, you should check our guide for setting up One-Click Report for your account. However, here are a couple of hacks straight from our team of expert media buyers.
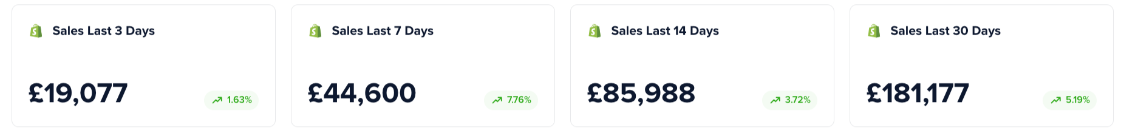
- Incorporate multiple time frames of the same metric in your report to track performance over time, such as 3 days, 7 days, 14 days, and 30 days. This makes it much easier to spot trends and see how the numbers flow, enabling you to identify your most profitable times.
- Compare metrics against each other for illuminating insights. For example, in the image below, you can compare Facebook ad spend and Shopify sales during the last 14 days. Analyzing this data helps you spot trends or instances where the performance peaked so you can identify and replicate what happened. You can also see that your ads are profitable as the ad spend remains consistently lower than your revenue.

- Make your reports your own with custom text you can use to create headings and sections.

How can I save a specific report?
Reports save automatically.
How can I add more metrics to One-Click Report?
You can add more metrics to a One-Click Report by clicking the edit button and dragging and dropping the widget type you want to use into one of the empty spaces. Once in place, click it to edit the metrics you want to see.
Can I request templates?
If there is a certain template you’re missing, you can either create it yourself and it saves automatically, or you can submit a feature request.
Can I use my company’s branding design in One-Click Report (white-labeling)?
While this feature is not available at the moment, it could be included in future One-Click Report updates. You can always check out our latest releases and subscribe for updates to be informed when we add this feature and others. Also, we’d love to hear of any other feature suggestions that would improve Madgicx for you.
The KPI that I want to select is not available in One-Click Report. What should I do?
Can I view multiple Google/Meta/TikTok/Shopify/Klaviyo accounts in a single report in One-Click Report?
Sure! You can connect multiple accounts - Meta, TikTok, Shopify, Google Ads, Google Analytics 4, and Klaviyo to Madgicx to see the data in One-Click Report. Click “Data Sources” at the top right of the page and add the accounts you want to connect to.
Is goal completion available for all metrics in One-Click Report?
Goal completion is only available for metrics that can be summarized, for example, clicks, ad spend, purchases, etc., and not for ROAS, MER, or conversion rates.
Can I export data from One-Click Report to share with my clients or team?
Sure. You can download the report as a PDF, and you can get a publicly accessible link to share with your clients. You also have the ability to disable the link should you no longer wish to share access to your report.
I have an error message in One-Click Report. What should I do?
Reauthenticate the relevant account in the “Data Sources” tab and try loading the report again. You can do it here.

Can I automate or schedule the sending of One-Click Reports?
Currently, we don’t have a feature to automate the sending of One-Click Reports. You can easily generate a public link for each report, where anyone can view it and see the data in real time. We recommend familiarizing yourself with the One-Click Report features so you can fully utilize this tool to your advantage.
Can I create reports in One-Click Report in a language other than English?
If you want to change the name of any widget in your report, click on that widget, and switch to the "Appearance" tab on the left-side menu. there, you may edit the title and subtitle as you wish.

For example:

You may also add custom text widgets in any language you wish by selecting the custom text widget on the left-side menu:


Didn't find what you were looking for?
Try our FAQ
Check out the answers to our most frequently asked questions. If you can’t find the answer there, you’ll be able to contact our support team.