Use Targeting Insights to optimize audiences and spot missing ones
Targeting Insights helps you identify any audience blindspots so you can:
🔍 Spot optimization opportunities to improve targeting
🌍 Find missing audiences and identify high-performing ones for your next campaigns
✂️ Trim budget waste spent on poor-performing audiences


One of the best ways to enhance your overall ad performance is to determine which audience targeting criteria yields the best results. If you use Madgicx, this is no longer guesswork. Targeting Insights helps you see which target audiences help reach your ad goals and lets you easily spot missing audiences to include in your ad strategy.
Targeting Insights shows you your audience performance broken down by each funnel stage
👋 Acquisition Prospecting
🤗 Acquisition Re-Engagement
🪝 Retargeting
😁 Retention
Madgicx analyzes all your target audiences and displays the efficacy of each audience type. By analyzing optimization metrics like the ROAS, Revenue, Amount Spent, or Cost per Purchase, you can spot targeting opportunities and leverage audiences with proven results.
Let’s jump straight in and start using this tool.
You can find Targeting Insights on the 360° Meta Audit page in the menu at the top of the screen. First, you should select a timeframe of audience data you want to see.
Choose the date range and wait for the data to populate the page.
Identify your top-performing landing pages 🧑🎓
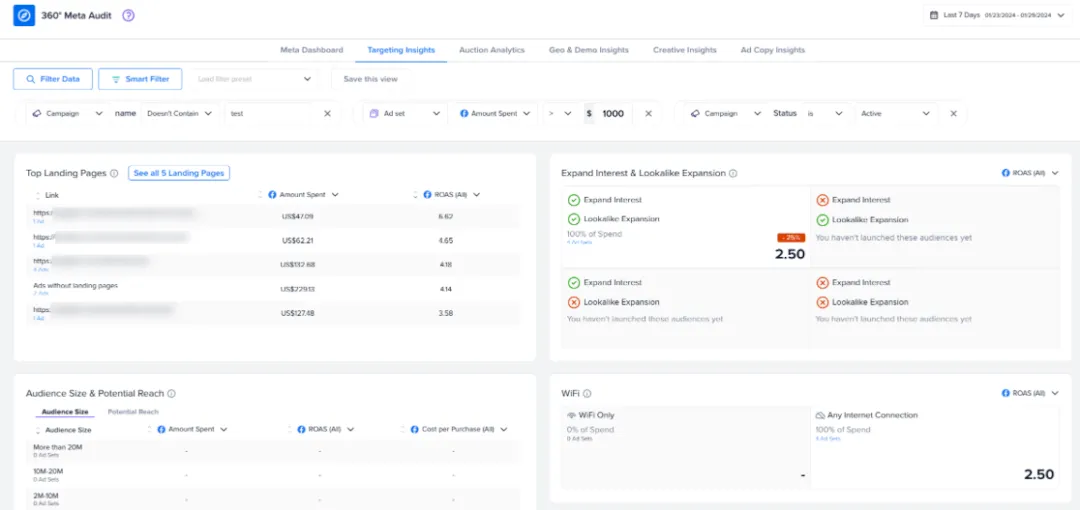
Here is a list of your most effective landing pages for your audiences sorted by ROAS by default. You can change the metric and adjust the order at the top of the columns where the arrows point in the image below.
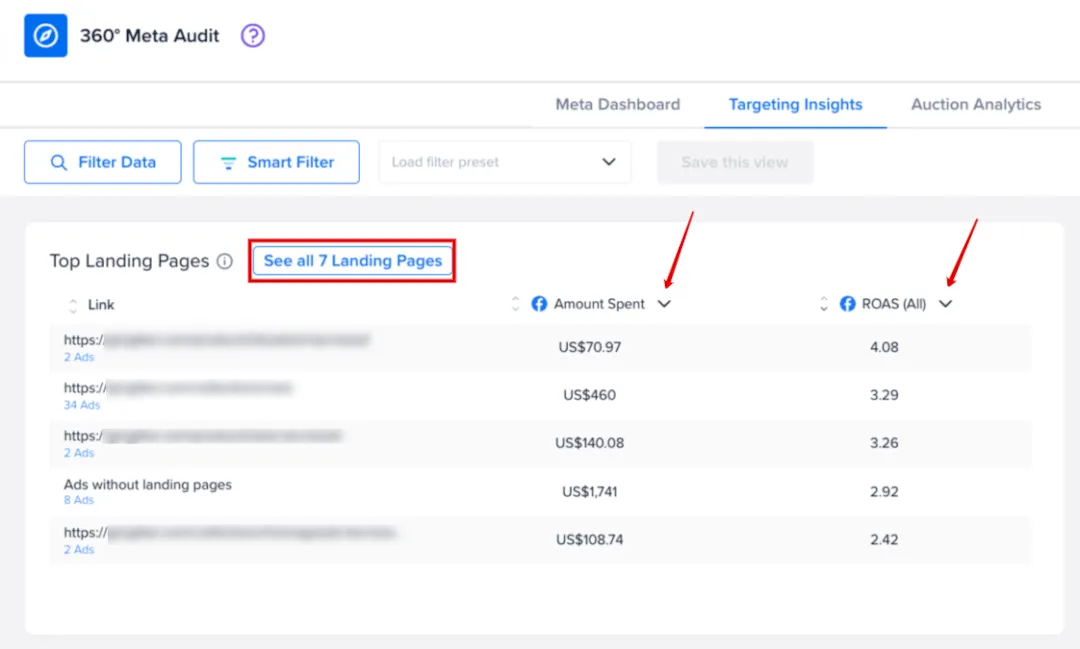
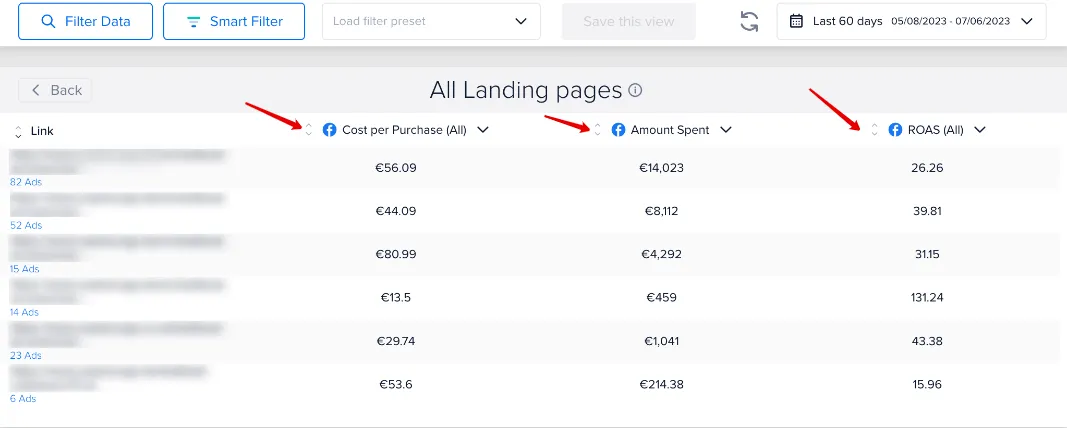
Click the ‘See all Landing Pages’ button circled above to view and compare all the landing pages used as destinations in your ads for this date range.
You can use this information to:
- Utilize your top pages in your next campaigns
- Pause ads leading to underperforming pages or change the pages they direct to
- Optimize your underperforming pages based on the successful ones
🦸 Pro Tip: The best approach is to view this as a funnel. If the CTR is low, that would indicate that it’s the ad's fault, not the landing page's. However, if there's a high CTR but a low number of page views, the page might be loading too slowly. Lastly, if the number of page views is high, but the ROAS or number of purchases is low, this might mean the content on the page is not converting.
You can also click on the blue ad count below each link to open that group of ads in Meta Ads Manager. You should do this if you want to pause any of those ads or change their target landing pages ⏸️
Filter your data to unlock key audience metrics 🧠
At the top left of the Targeting Insights page are the Filter Data and Smart Filter buttons.

The Filter Data feature, when used on Targeting Insights, lets you segment your performance to focus on specific audiences you want to analyze. To sum it up, you can view audience data such as your landing pages, expand interest and lookalike expansion settings, the estimated audience size, lookalike %, recency, and Wi-Fi settings, and filter them according to the funnel stage, campaign type, and status.
You can easily exclude or add other filter conditions that are relevant to you. Then, make sure you click the blue “Apply” button to add your filter condition.
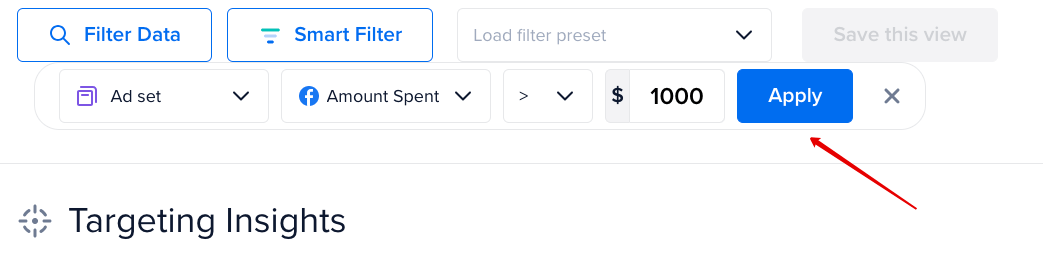
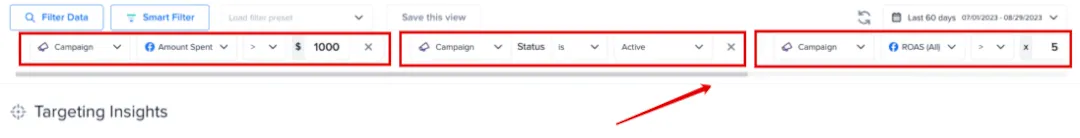
For example, in the images below, I’ve made the Amount Spent on each ad set more than $1000 to make sure enough budget has been spent to gather results. Furthermore, I’ve defined only active campaigns that have a ROAS that is 5 or higher and a condition to exclude any campaigns with the word “test” in the name.
Simply scroll the grey bar to the right to see them all. You’ll find it under the conditions.
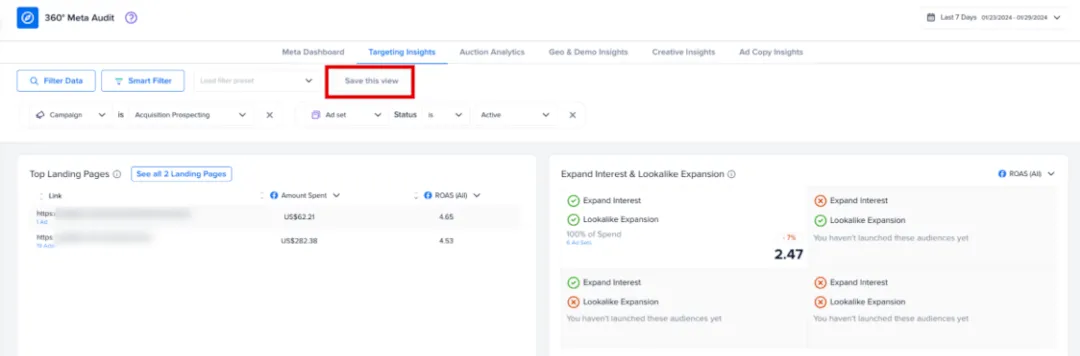
Lastly, you can save your favorite view as a preset for next time. Simply click ‘Save this view.’
Let’s look at Madgicx’s Smart Filter 🤖
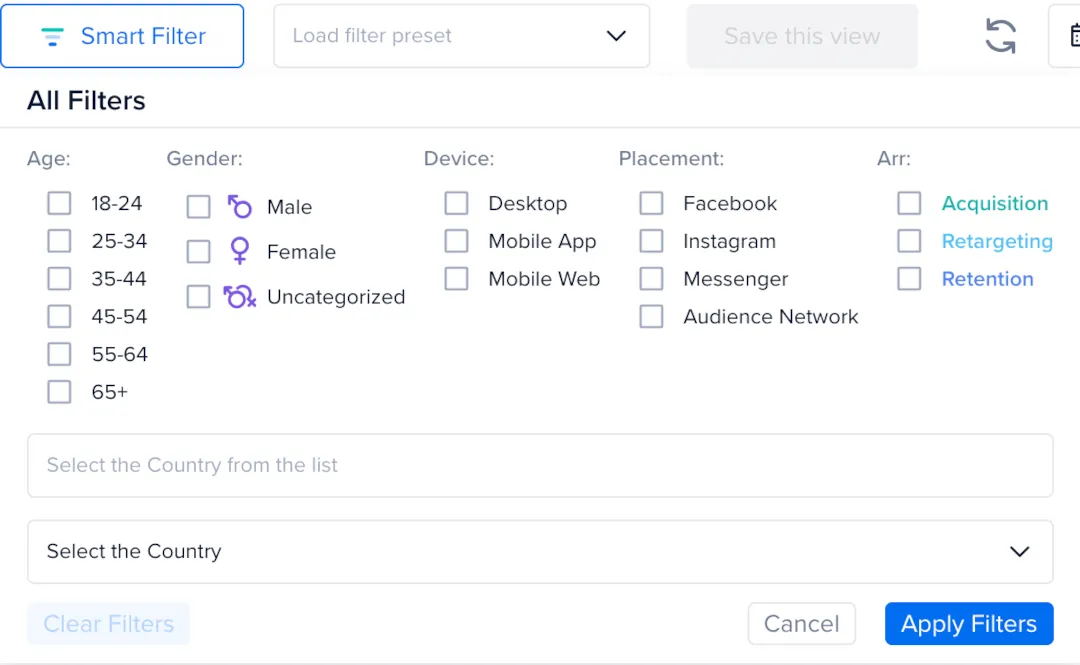
When using the Smart Filter, you can see how your different audiences and landing pages perform by funnel segment. You can also filter your audience data by demographics, device, and ad placement. This data gives you a deeper understanding of what works across your audience segments.
Amplify performance with Expand Interest and Lookalike Expansion
This widget refers to Meta’s Advantage detailed targeting tool, which helps enhance the performance of your ads. It shows your ad to a broader audience than you’ve defined using its system’s ability to identify accounts likely to respond to your optimization goal or to get cheaper results.
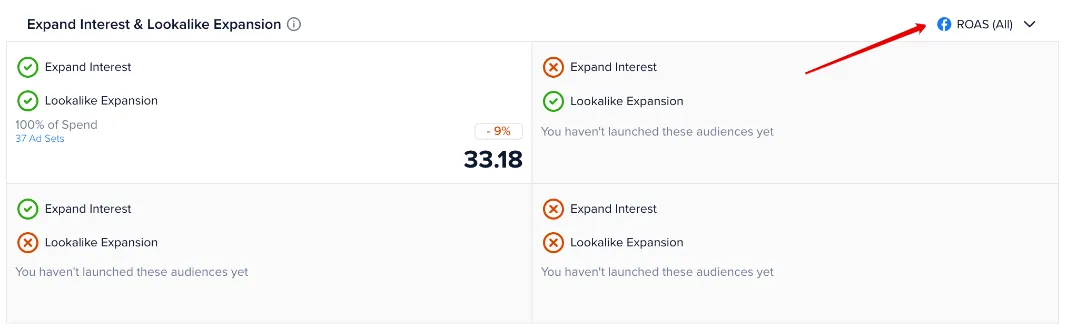
When you look at the Expand Interest and Lookalike Expansion widget, it shows which expansion tools you use in your audiences. You can adjust the metric to analyze the performance of each of these strategies by your most important KPI by clicking ‘ROAS (All)’ at the red arrow point.
The image above tells us that 100% of the ad spend goes to audiences that are using Advantage detailed targeting to optimize audience performance. This means that this account hasn’t tested any other strategies, and it might be missing out on opportunities here.
Once all methods are tested, you can understand which of them works best for you and utilize it more often in future campaigns.
See the estimated size and reach of your audience 📐
With this widget, you can analyze the estimated audience size and potential reach of your ad sets by Amount Spent, ROAS, and Cost per Purchase. You can sort the table by each metric or by the different audience size segments.
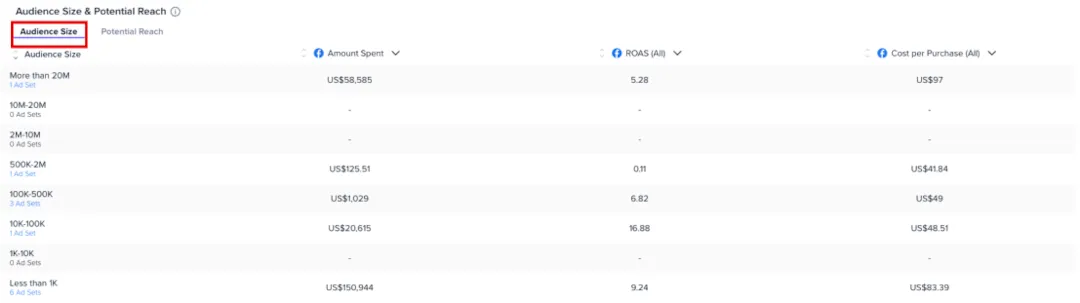
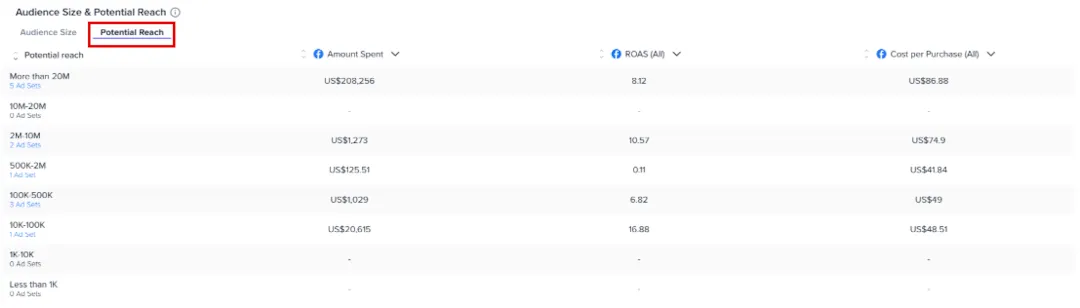
This widget gives you a breakdown of your audience performance by size according to your chosen metrics. Simply click on the down arrow in each column to change the metric. To switch the view to “Potential Reach,” simply click on this tab.
You can see from the image above that the 2-10m user audience size has a high ROAS and higher cost per purchase.
In addition, the smaller audience of between 10k-100k users has a high ROAS by comparison. With a lower Cost per Purchase, it’s a profitable audience and performs well.
Remember, you can’t compare Retargeting or Retention against Prospecting - your Retargeting and Retention audiences should naturally have a higher conversion rate and lower Cost per Purchase.
We should create smaller audiences like this to test.
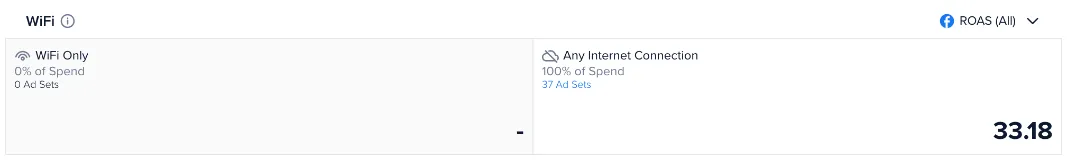
To Wi-Fi or not to Wi-Fi 📶
The Meta Ads Manager uses any internet connection type as the default setting. So, Wi-Fi-only targeting might work better in certain situations because this might mean people have a moment to sit down, relax, and complete the order on your website or if you’re targeting a country with prohibitive mobile data costs. However, this is not always the case, so you should test both targeting options.
Fully utilize Lookalike % & Recency 🛠️
This widget breaks down the performance of the lookalike audience segments you’ve set and the recency settings for retargeting. Just click the heading at the top to switch views.
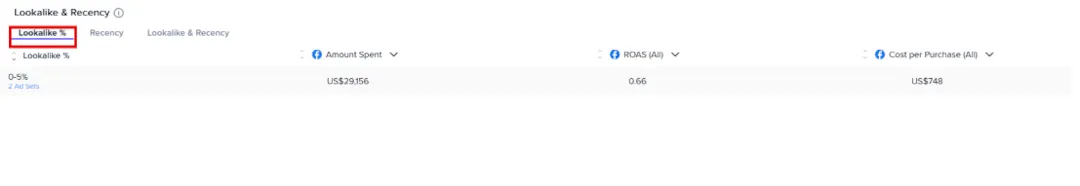
Lookalike %
By setting the lookalike percentage, you can determine how closely the algorithm matches the profiles it selects for your new audience. If you define a lower number, it matches profiles closely with the audience it's duplicating, and a higher percentage will have broad relevance.
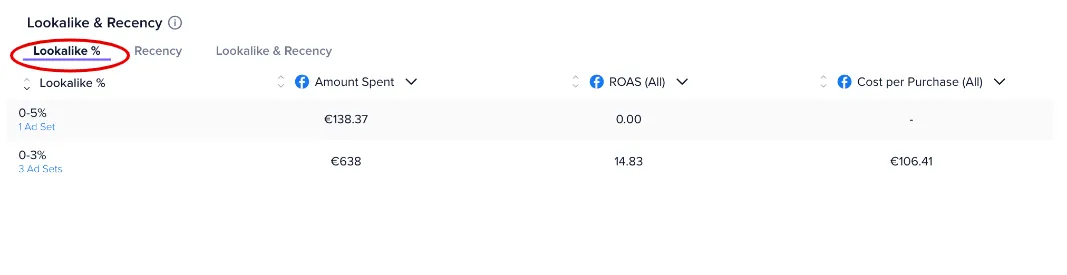
The image above shows that lookalikes between 0-3% perform better. But, with only 1 ad set running a higher lookalike percentage, the results are fairly inconclusive. This account should create more lookalike audiences with different percentage settings to test for the best performer.
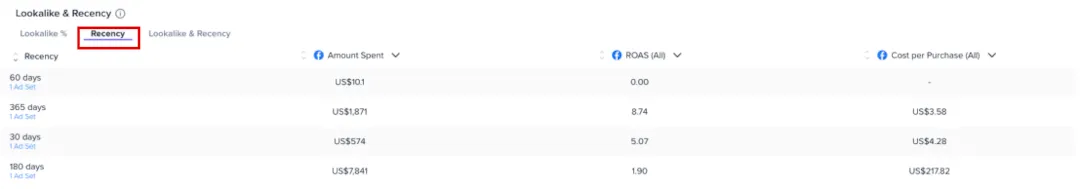
Recency
This refers to the timeframe setting of the last interaction between a user and the account’s Meta Pixel you set when creating a retargeting audience. Madgicx analyzes the performance of these settings you’ve tried before and helps you choose the best recency period to use next. In the image below, the first audience targets people who have interacted with the Meta Pixel in the last 60 days, and the second targets profiles who have interacted with it over the last 180 days.
The 180-day audience’s ROAS is outperforming the 60-day one, and your cost per purchase is lower, meaning your ads are more profitable.
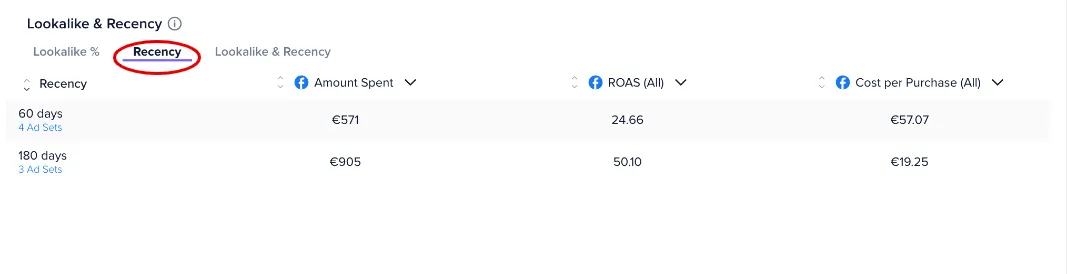
We should continue testing different recency settings across more ad groups to gather more insights, and we should focus more on the 180-day audiences.
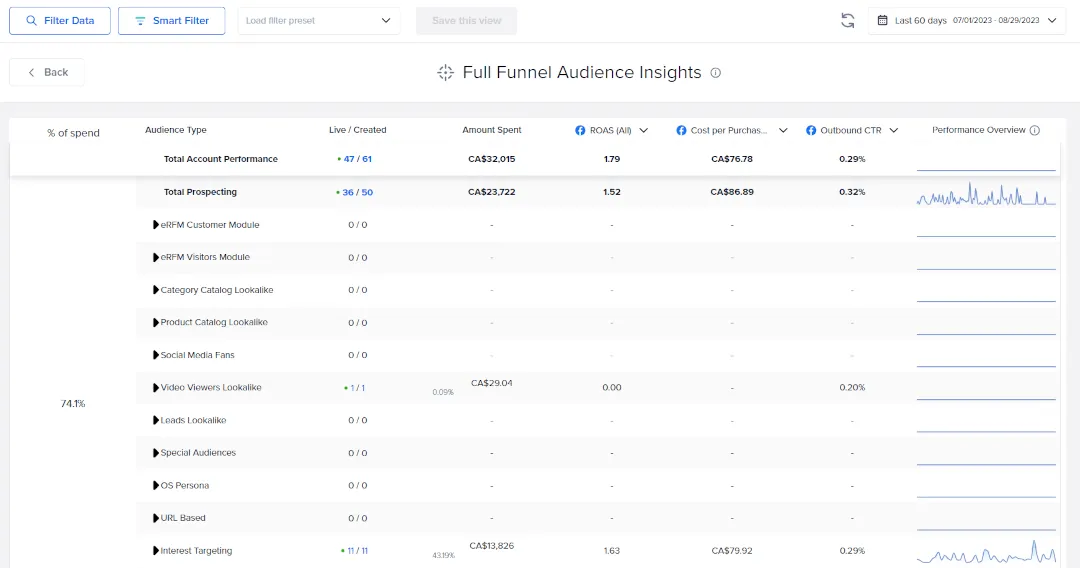
See ad efficacy across the full sales funnel 🤓
How to understand the Targeting Insights Across the Full Funnel widget
See the performance of your audiences across all stages of your sales funnel:
📢 Acquisition Prospecting
🤝 Acquisition Re-engagement
🪝 Retargeting
❤️ Retention
In the first column, you’ll find the percentage of ad spend for each stage so you can ensure you are distributing your ad spend appropriately across the funnel stages. We recommend allocating at least 80% of your ad budget toward both Acquisition stages.
Then, you’ll find the audience type, the Live vs. Created stats, and the Amount Spent.
You can also replace the KPIs with the optimization metrics of your choice. Click the arrow and choose from the list of metrics provided.
Lastly, you have a visual graph of the performance trend for that audience type.
Acquisition Prospecting 📢
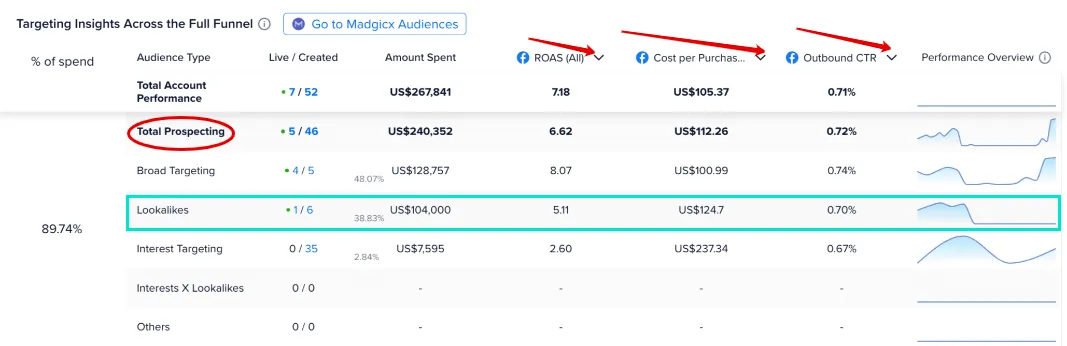
In the Acquisition Prospecting stage, we can see that the ads that use Lookalike audiences have a negative performance trend with the ROAS below the prospecting performance average. Therefore, we should consider pausing this audience and reallocating some of the budget to broad targeting that shows the best performance.
This account appears not to have tested any combinations of lookalikes with interests. We recommend giving this a try!
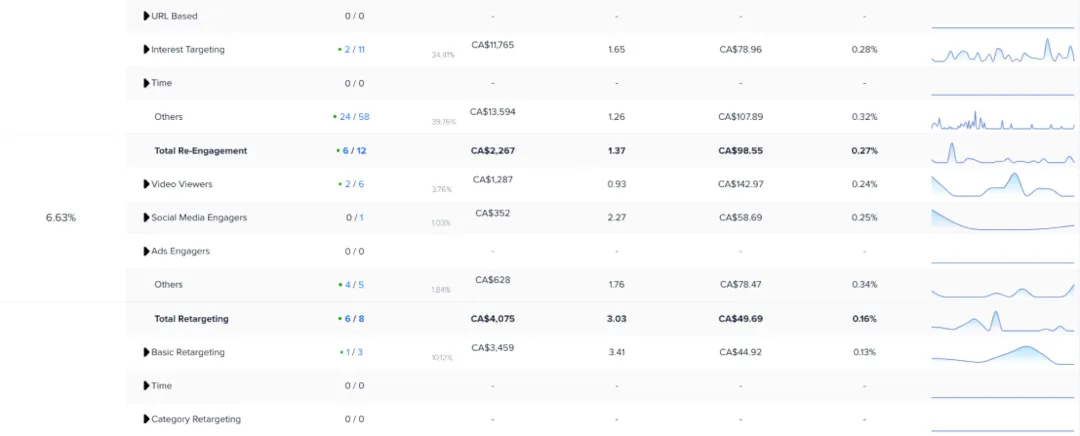
Acquisition Re-Engagement 🤝

Then, in the Acquisition Re-engagement section, you can see that no ads target profiles who have interacted with their social media pages. No ads target profiles that engage with the ads either. Therefore, launching these audiences so you can target these profiles could make a massive difference to the business bottom line and is a missed opportunity.
The audiences categorized under ‘Other’ indicate they could be custom audiences or use other ways of audience building, like from a list or by ID, or even stacked audiences, which means they’re combined. This could also indicate that the audiences have already been tested.
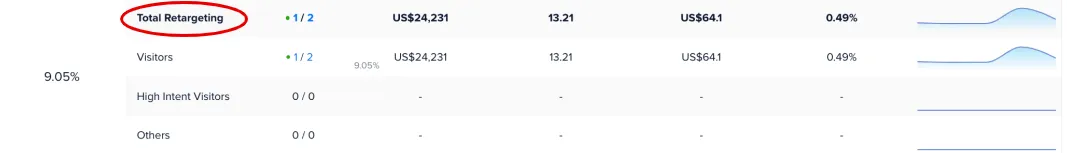
Retargeting 🪝
For Retargeting ads, you must configure the Meta Pixel to track your website visitors, abandoned carts, and high-intent visitors. These users are ready to purchase and perhaps got distracted or decided against it at the last minute. As a result, they need very little persuasion to buy because they have already come so far through your funnel. As a result, you don’t have to work as hard for the purchase 👷
In addition, this audience type may even purchase more than they originally intended. They’re hot and ready to buy! 🤑
In the image above, you’ll see this account targets website visitors but not high-intent visitors. They could be missing out unless they target these visitors, who might only need a nudge to become a customer.
In conclusion, by advertising to this group of users who have triggered the Meta Pixel, you can work to close the gap on abandoned carts - a massive bugbear for e-commerce sites.
And, if you’re not tracking your website visitor actions and targeting ads accordingly, know that your competitors are.
Retention ❤
The Retention funnel stage helps you nurture client relationships and encourage previous customers to buy again. It uses the Meta Pixel and email-based targeting to achieve this.
By not targeting these audiences, you could be missing out on even more revenue.
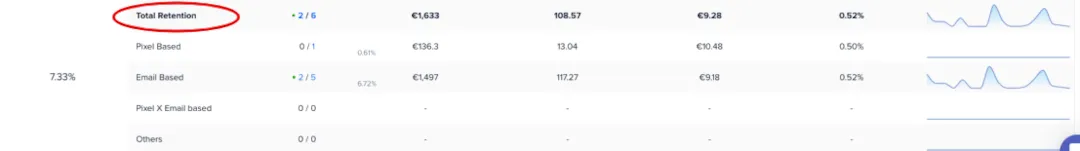
The account in the image above isn’t using Meta Pixel-based targeting at this stage, as the one ad set is not running. They should try launching more ads using the Meta Pixel and the combination of pixel and email-based targeting.
In summary, identifying these audience gaps tells you who to target next to improve your overall ad performance.
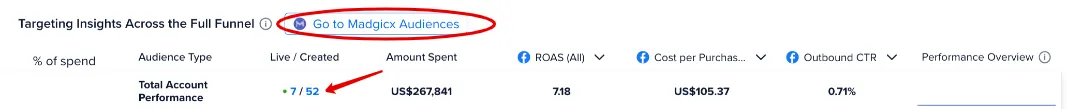
For a deeper analysis where you can play with even more metrics, click ‘Go to Madgicx Audiences’ circled in the image above to go to Full Funnel Insights. ⬇️
Analyze all audiences with Full Funnel Insights 👀
You can find Full Funnel Insights in the Madgicx menu or click the ‘Go to Madgicx Audiences’ button on the Targeting Insights page.
The Full Funnel Insights tool presents your audience data for comparison across your full marketing funnel in a list of the Madgicx audience presets. You can identify which audiences are in place and which ones are most effective based on the metrics that matter most to you.
Let AI create winning lookalike audiences using eRFM
The eRFM Module widget analyzes the performance of your eRFM audiences to show you which ones you still haven’t tested and helps you identify the ones that work best for you.
The eRFM audiences are our AI audiences, which are lookalike audiences created according to the eRFM model:
- engagement
- Recency
- Frequency
- Monetary value
These lookalike audiences are based on your website visitors as well as your customers and are created by Madgicx’s artificial intelligence system.
You can launch a new ad set using the specific audience defined by the eRFM presets. Simply click ‘Create ad set’ and follow the instructions to launch the audience (we have a step-by-step guide below if you need help).

Difference with Facebook Ads Manager
Targeting Insights takes the guesswork out of your audience management. Madgicx gives you performance insights across each funnel stage that help you identify which audiences work best for each stage.
How can I tell if there is an audience missing from my sales funnel?
You can do this by looking at your Targeting Insights Across the Full Funnel widget. There you can see whether you’re missing any funnel stages and audience types.
To fix this, go through each funnel stage to ensure audiences are in place for each one. To summarize, the missing data is what we’re looking for. See the red boxes below.

The red boxes in the image above indicate where you are missing audience data. Your sales funnel is incomplete without Acquisition Prospecting, Acquisition Re-Engagement, Retargeting, and Retention audiences in place. We can increase performance by targeting these people.
Make sure you’ve configured your Meta Pixel correctly and launch these audience types in the Audience Launcher!
How do I pause ad sets using audiences that aren’t performing?
Firstly, it’s always better to pause your ads than to delete them. This way, you preserve your data.
By clicking the blue numbers in the Live/Created column where the red arrow is pointing in the image below, you will go to Meta Ads Manager and see a list of these ad sets. Find the ones you want and pause them.
How do I create a new audience in Madgicx?
- Head to Audience Launcher in the Madgicx menu.
- You can scroll down until you reach the funnel stage you want to target or use the filter on the left to find it. Then you can explore the list of preset audience options that Madgicx has created.

- Select the audience presets you want to include by clicking them, then click ‘Next.’

- Choose the campaign(s) to launch your audience(s) into. You can use Madgicx’s optimized structure and set the campaign objective, use an existing one, or create a new campaign.

- Next, select the ads you want to use. You can use the same ads for all the ad sets by highlighting all the audiences at the top of the page or do this one by one. We recommend using different ads for different funnel stages.

You can adjust the timeframe and use the filter to search for specific ads. Click “Save Changes” to continue.

- Set the locations for the target audiences. You can include and exclude countries according to your ad strategy. Again, you can use the same settings for all ad sets or do this one by one.

- Then, finish configuring the settings for your audience(s) and click “Save Changes.”

- Here, you set when you want to launch your audience(s) and define your naming convention. At the bottom of the screen, you’ll see a summary of your ad sets with their relevant settings. Once you’re happy with them, click the blue ‘Launch’ button at the top right.

- That’s it! You’re done.
Why are my audiences categorized as ‘Other’?
This is likely because you’ve created Custom audiences, not the Madgicx audience presets you see listed. When you include multiple targeting variables or if you combine audiences, it creates a custom audience that falls under the ‘Other’ category.
With many variables available to include in your targeting, we recommend simplifying the process when you’re starting. By segmenting audiences, you can analyze how each audience performs and identify the best targeting settings for you.
Furthermore, when using this process, you can build a high-performing audience with the data that you’ve learned as you go along.
If your ad sets display under Other, look at the category stage on the left that indicates the stage this audience falls under. You can click the blue ad set count number to open Ads Manager to view the audience settings.
🦸Pro Tip: Use the Madgicx audiences listed in the column as your to-do list to close the audience gaps in your account.
Related lessons
Didn't find what you were looking for?
Try our FAQ
Check out the answers to our most frequently asked questions. If you can’t find the answer there, you’ll be able to contact our support team.